Cilium + EBPF: Observability and Security in Kubernetes
 Angel Azuara Eizaguirre included in Personal Projects
Building robust and secure clusters is one of the main challenges for those of us who work with cloud infrastructure. In Kubernetes-based environments, it is not enough to deploy the services: we also need to make sure they communicate securely and have a reliable observability system that lets us understand what is going on inside the cluster.
In this article we will see how to set up Cilium in a local environment to manage the network and security of a Kubernetes cluster, including L3/L4/L7 policies with CiliumNetworkPolicy, encryption between nodes with WireGuard and service exposure through the Gateway API. We will also show how to program and deploy eBPF agents inside the cluster, extending what Cilium already does. Finally, we will implement a metrics system built around Hubble, which will export metrics to Prometheus so we can visualize them with Grafana.
As a use case we reuse the microservices from the GitHub repository, with a few modifications. To keep the focus on the main goal of the article, all the OAuth 2.0 flow code has been removed and some requests have been changed to show the difference between a gRPC implementation and a REST one. All of this is covered in the Microservices section.
1 Basic Concepts
To understand the infrastructure we are going to build, we first need to go over a couple of concepts.
1.1 What is eBPF
eBPF (extended Berkeley Packet Filter) is a Linux kernel technology that lets us run our own programs inside the kernel, without touching its source code or loading modules. These programs are attached to hooks, which are specific points in the kernel’s execution: a syscall, a tracepoint, a packet arriving at a network interface… When that event happens, the kernel triggers our program.
Before running it, the kernel passes it through the verifier, which checks that the program terminates, that it doesn’t access memory it shouldn’t and that it can’t bring the system down. That’s why eBPF is considered a safe way to extend the kernel. In addition, programs are compiled to machine code (JIT), so they are fast, and they can talk to user space through maps, which are data structures shared between both sides. We will see this in the agent part.
What do we gain from all this? We can observe and act at a very low level, with very little overhead and without modifying the applications or adding a sidecar to every pod. We detect and fix certain problems right where they happen, saving time and resources.
1.2 What is Cilium
Cilium is a cloud native project based on eBPF that brings networking, security and observability to Kubernetes. In essence it is a CNI (Container Network Interface), the component in charge of giving the pods a network, but it does quite a lot more than that.
For example, it can replace kube-proxy. The latter implements Services with iptables rules, which are evaluated sequentially and become slow and hard to debug as the cluster grows. Cilium does that job with eBPF programs and maps, which resolve the destination with a direct lookup instead of walking a list of rules.
Futhermore, its network policies are based on the identity of the pods (their labels) and not on IPs that change all the time, and they can go up to layer 7. It also adds encryption between nodes with WireGuard, support for the Gateway API and Hubble to see what is happening in the network.
And since Cilium is built with eBPF, it makes total sense that we end up programming our own agents. That’s what this article is about.
1.3 Other Concepts
Besides that, although they carry less weight in this article and you probably already know some of them, we will also use:
Prometheus, which collects and stores metrics, and Grafana, which lets us draw them as charts and dashboards.
Hubble, a tool from the Cilium project that shows the flows and events happening in the cluster. We will export its metrics so that Prometheus can read them and we can see them in Grafana.
gRPC and REST, two ways of building APIs that we will compare in the article, with their pros and cons.
- gRPC is an open source remote procedure call (RPC) framework, initially created by Google. It uses HTTP/2 as transport and Protocol Buffers to describe the interfaces and serialize the data in binary.
- REST (Representational State Transfer) is an architectural style, not a protocol, that brings reliability, efficiency and scalability to distributed systems. It is usually implemented over HTTP/1.1, representing resources in JSON or XML, which are plain text formats. This makes them more readable, but also heavier than Protobuf’s binary format, and therefore slower to transmit.
Later on we will take a quick look at the difference between both implementations.
2 Overview
Now that we’ve covered these concepts, and to illustrate how they fit together, here is the architecture diagram I propose.
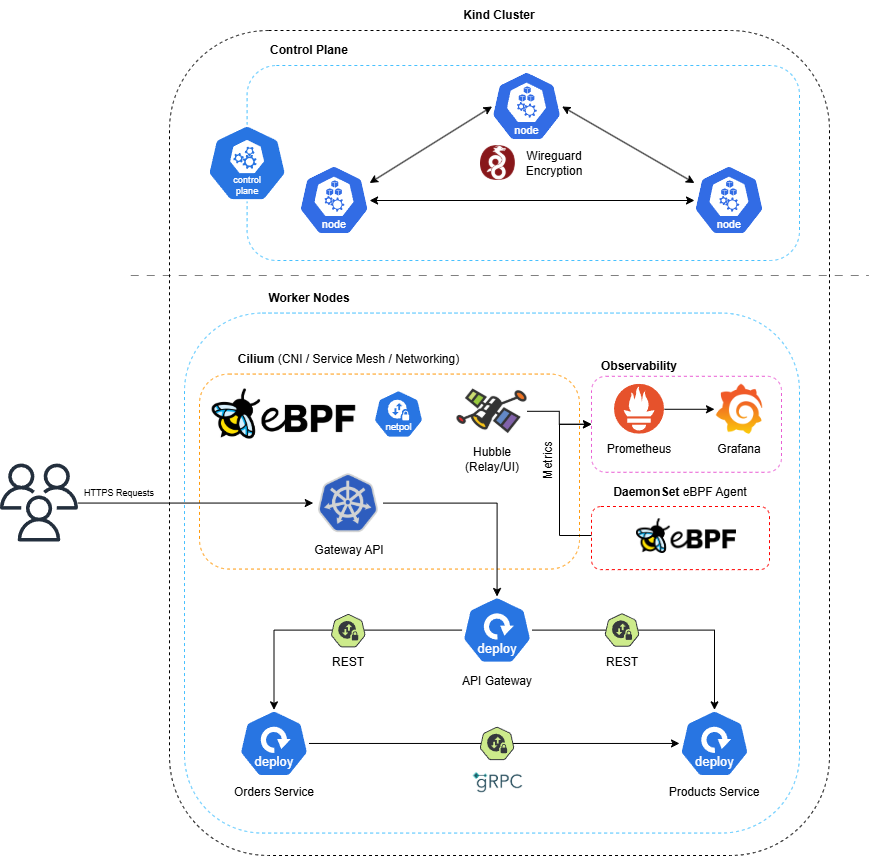
As you can see, we have a kind cluster with 4 nodes: one control plane and 3 workers. Between nodes we apply transparent encryption: WireGuard encrypts the traffic at kernel level without the applications having to know anything about it. Inside the workers runs an application made of 3 microservices that communicate through REST and gRPC, and whose traffic is restricted with Network Policies.
Additionally, we deploy two eBPF agents as DaemonSets. One measures the latency of TCP connection establishment and exposes it as metrics for Prometheus. The other blocks the commands we tell it to in the pods we choose, and also exposes metrics.
Finally, Hubble gives us visibility into network flows, and both its metrics and those of the Cilium agent and operator are collected by Prometheus. Grafana takes care of drawing all that data in charts.
Don’t worry if some concept slips by, we will go through everything in detail when the time comes.
3 Prerequisites
The following tools were used to build the entire setup. Versions may matter, as some features and behaviors can change between releases.
- Environment: Windows + WSL2 (Arch). On native Linux it should work the same.
- Kernel 6.6.87.2-microsoft-standard-WSL2. It already ships with BTF and BPF LSM compiled in, but
bpfhas to be activated in the LSM list (I explain how later). - Docker Desktop 4.45.0 (Docker Engine 28.3.3), with the WSL2 integration enabled
- kind v0.33.0 and Kubernetes v1.34.0
- kubectl v1.32.2
- Helm v4.3.0
- Cilium 1.20.3 (cluster) and Cilium CLI v0.20.1
- Hubble CLI v1.19.4
- Go 1.27.2
- clang/llvm 23.1.3, only if you want to compile the eBPF code by hand. With the Docker images from the repo you don’t need it.
All the code for this post, including the .yaml manifests, is available at the following links:
- Microservices code (
grpcbranch): https://github.com/azuar4e/micros-sample/tree/grpc - eBPF agents code: https://github.com/azuar4e/ebpf-observability-security
That said, let’s get to the implementation.
4 Cilium: Installation and Configuration
A Kubernetes cluster needs a CNI so that pods have a network. Without one, nodes stay in NotReady and pods don’t start. kind ships with its own by default, kindnet, but we want Cilium to manage the cluster’s network so we’ll disable it when creating the cluster.
As we saw, Cilium is a CNI built on top of eBPF, and you can tell because L3/L4 network decisions are resolved directly in the kernel, without going through user space. But it doesn’t stop there, and there are two things worth keeping in mind before moving on.
The first is that Cilium can also act as a service mesh, which is the infrastructure layer that manages communication between services. The classic Mutual Authentication has been deprecated since 1.20, and the new alternative, sidecar-less mTLS with ztunnel, is still in beta. If you need a complete service mesh, you can run Istio or Linkerd on top of Cilium, but that is out of the scope of this article.
The second is that Cilium deploys an Envoy on every node, which is the one that applies the L7 policies (HTTP and so on) from the network policies. I mention it because many people think a CNI is limited to L2/L3/L4, and that doesn’t have to be the case.
Now that we’ve covered the basic theory, let’s get practical. The first thing is to create the cluster:
| |
This deploys a kind cluster with three workers besides the control plane. Since we are going to use Cilium as CNI (replacing kindnet) and it takes care of the kube-proxy functions thanks to eBPF, we disable both in the kube-config:
| |
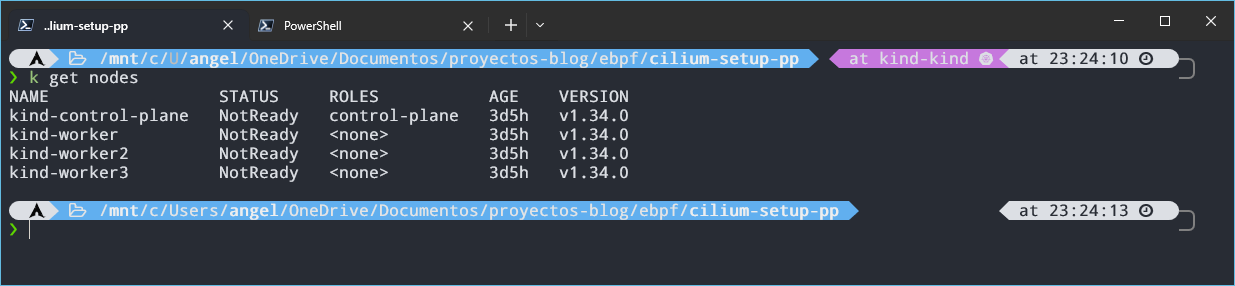
As we can see, the nodes are in NotReady, and that’s expected: we don’t have a CNI yet, so the pods can’t have a network. We fix that by installing Cilium:
| |
With this, Cilium replaces kube-proxy, as mentioned earlier, and also enables WireGuard encryption for traffic between pods on different nodes. We could also set encryption.nodeEncryption=true to extend encryption to node-to-node, pod-to-node, and node-to-pod traffic, rather than just traffic between Cilium-managed pods. However, this feature is in beta.
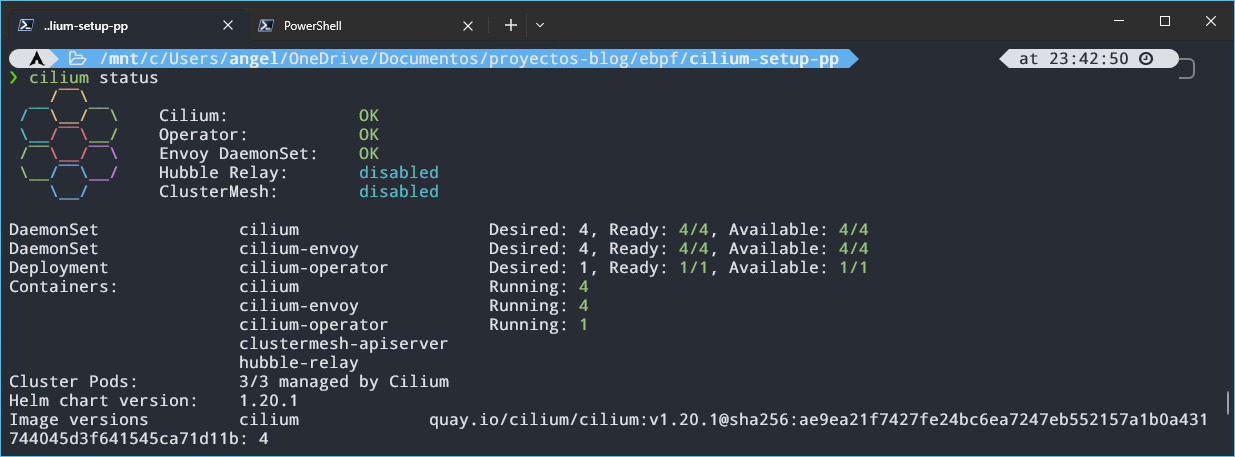
We wait a few seconds and check with cilium status that everything is ready. If it is, the nodes should switch to Ready.
In the image we can see 4 Envoys running, one per node (three workers + control plane), and also that Hubble Relay and ClusterMesh are disabled. ClusterMesh is used to connect several clusters, so we don’t need it for now. Hubble Relay is the piece that gathers the flows that Hubble sees on each node so they can be queried from a single place, so let’s enable it:
| |
This enables Hubble Relay together with the UI (the web interface). We run cilium status again and we should see them as OK. We will go over Hubble in more detail in the observability section, but while we’re at it, let’s enable the metrics of the Cilium agent and the operator:
| |
We could also have added this to the
cilium installat the beginning and saved ourselves the upgrade. Without--version,cilium upgradewould use the CLI’s default version, which may not match the one installed in the cluster.
The first command enables the /metrics endpoint of the agent and the operator in a format Prometheus can read, and the second restarts the Cilium pods so the change takes effect. These are Cilium’s metrics. Hubble’s (flows, DNS, drops…) are enabled separately with hubble.metrics.enabled, and we will configure them later.
Now it’s the turn of the Gateway API, the successor of Ingress, which works at L4/L7. We will use it to have a single entry point with HTTPS. First we need to check which version of Cilium we have and look in the documentation for the Gateway API version it requires:
| |
Change the version in the URL for the one you have. In my case they ask for v1.6.1, so I install the CRDs with:
| |
With the CRDs installed, we have to modify the Helm values. Since we installed Cilium with its CLI, it’s likely that we don’t have the Cilium repo added to Helm:
| |
And now we enable the Gateway API:
| |
The agents and the operator only detect the CRDs when they start, so we restart them so they see them:
| |
We check that the GatewayClass is deployed:
| |
To configure HTTPS we create a self-signed certificate (it’s a local environment) with its private key, and with the two resulting files we create a Kubernetes secret:
| |
Now we create the Gateway, telling it to listen on port 443, the protocol and the secret we just created:
| |
Finally, we need an HTTPRoute so the Gateway knows where to route. Here we will only use one, which sends the traffic to the API microservice, which we will see in the next section. We could also add, for example, a listener on port 80 and, with another HTTPRoute, redirect to HTTPS.
| |
5 Microservices: REST vs gRPC
As we mentioned before, we are going to reuse the microservices from the last post on the blog. A quick recap, in case you haven’t read it: we have 3 microservices, an API gateway (apigw), an orders service (orders) and a products service (products), as you can see in the architecture diagram. The user makes requests to the API and it forwards them to the services over HTTP. From orders we can create orders (validated with a request to products) and list them, and from products we can list the available products.
In the original post all of this was protected with OAuth and Keycloak as the IdP. Here I’ve removed it to keep the focus on the goal of the article, but if you are interested you can find the explanation in this link.
The other change is that communication between orders and products is now gRPC. As we saw in the concepts, gRPC uses HTTP/2 as transport and Protocol Buffers to define the contracts, so data travels in binary instead of plain text like JSON or XML. This usually translates into better performance and less traffic, especially in internal communication with lots of calls.
The API Gateway will keep talking REST to both orders and products, so products exposes both interfaces at the same time: REST towards the gateway and gRPC for the calls from orders. This way we can compare both protocols inside the same architecture.
This is the directory structure:
| |
The
protofolder is at the same level asorder-serviceandproduct-servicebecause both need access to that code.
For the implementation, the first thing is to create a .proto file where we define the products methods (proto/product.proto):
| |
Here we define two RPC methods for the ProductService service: one lists the products and the other returns a product by its identifier. The numbers in the message fields are not values, but the identifier of each field in the binary encoding, and they shouldn’t be changed once the service is in use. repeated means the field is a list, like in GetProductsResponse, which returns an array of products.
Pay attention to the
package productsand the service name. When gRPC travels over HTTP/2, every call is aPOSTto the path/products.ProductService/MethodName. That is exactly the path we will use in theCiliumNetworkPolicybelow.
Once the protocol buffer is defined, let’s generate the code from it. The first step is to create a Go module so the generated code can be imported both from orders (client) and from products (server):
| |
Note that we use the same module name as the one defined in
go_packagein the proto.
Now, from the root of the proto directory, we run:
| |
This generates the files product.pb.go and product_grpc.pb.go. The first one contains the messages and everything needed to serialize and deserialize them, and the second one the gRPC service code: the client and server interfaces, among other things.
To use this code, in the go.mod of each microservice we need to add github.com/azuar4e/proto v0.0.0 inside require and the line replace github.com/azuar4e/proto => ../proto. The require declares that the microservice depends on that module, and since it is local and has no published versions, we use v0.0.0. The replace tells Go where to find it locally: in ../proto. As an alternative, you could have a repository with the protos and the generated code, publish versions of the module with tags or releases and give the microservices access to that repository.
Now let’s look at the gRPC code of products:
| |
The server type defines the server and embeds the default implementation, UnimplementedProductServiceServer, which lets us implement only the methods we want. The rest of the code implements those methods with the messages we defined in the proto. To start the server all we need is:
| |
The REST server code goes right before. The only difference is that its
Run()is launched inside a goroutine so it doesn’t block and the gRPC server can start afterwards.
As you can see, we open a port, create and register the server and make it listen. With this we have the server side, so let’s move on to the client, which as we said is the orders service:
| |
Here we create the client without TLS (it’s a test environment), pointing to the products Service and the port where the server listens. OrderHandler is a struct that holds the gRPC client for products, so the orders handlers can call it. The method that lists the orders stays the same, and in the one that creates them the call to products changes:
| |
That said, let’s move on to the deployment in the cluster. The original repo (main branch) contains some manifests that we will need to modify slightly, but first we have to build the images. Each microservice comes with a Dockerfile, so for the API gateway we go to its folder and run:
| |
products and orders use code from the proto, so their Dockerfiles have been modified to include that folder. That’s why the commands must be run from micros-sample (root directory): we need that build context so Docker can see /proto.
| |
Once the three images are built, we have to load them into kind, because its nodes can’t see the images in your local Docker:
| |
| |
We pass the image names as arguments and, with
--name, the name of the cluster.
To deploy the microservices we run:
| |
This deploys the Deployments and Services of the microservices, as well as the Gateway we saw in the previous section and the network policies we will see next.
Before we can make requests we need to set up a couple of things. Until now, the usual thing was to port-forward to the API and send requests from Postman or another client, but here things change. The Service that the Gateway creates (cilium-gateway-shop-gw) has no selector, so kubectl port-forward has no pod to point to, and it is designed that way.
The solution is to build a bridge with socat, a container that listens on a port of our machine and forwards the traffic to a node of the cluster. The path looks like this:
| |
To set it up we need two pieces of data: the port of the Gateway Service and the IP of a node.
| |
In the
PORT(S)column of the first command you will see something like443:30487/TCP, and the number on the right (30487) is the one we care about. The node IP is in theINTERNAL-IPcolumn, and any node’s IP works.
Now we launch the container:
| |
Change the IP and the port for your own values. We connect it to the
kindnetwork so it can reach the nodes’ IPs, and8443can be any other free port on your machine.
Finally, the client needs to know how to resolve shop.local (hostname defined in the Gateway manifest), so we add this line to the hosts file:
| |
On Windows it is at C:\Windows\System32\drivers\etc\hosts and you have to open it as administrator:
| |
If you are on native Linux it’s the same, but with your own /etc/hosts.
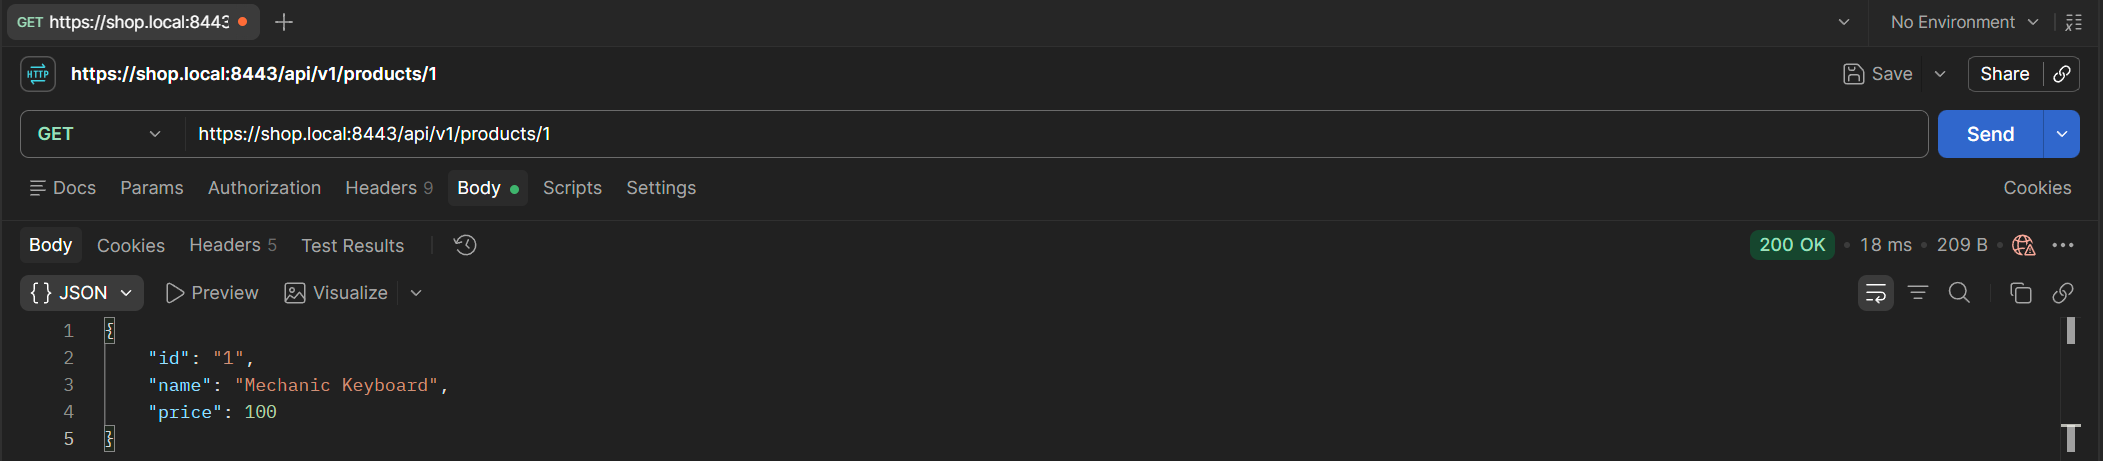
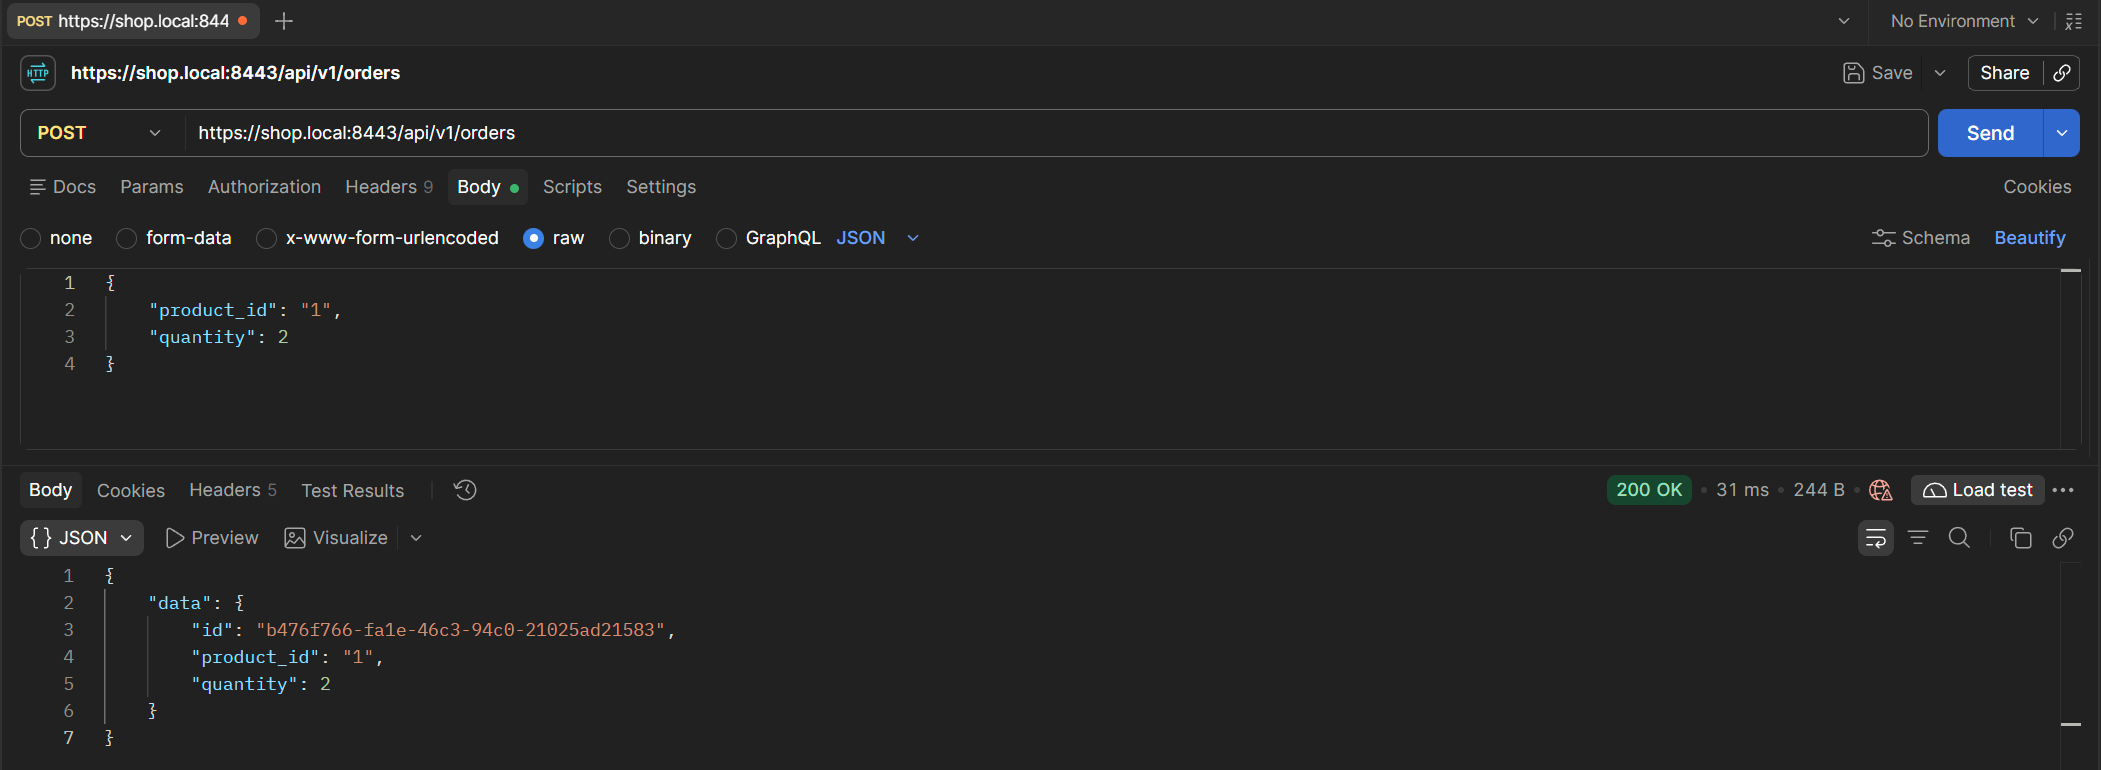
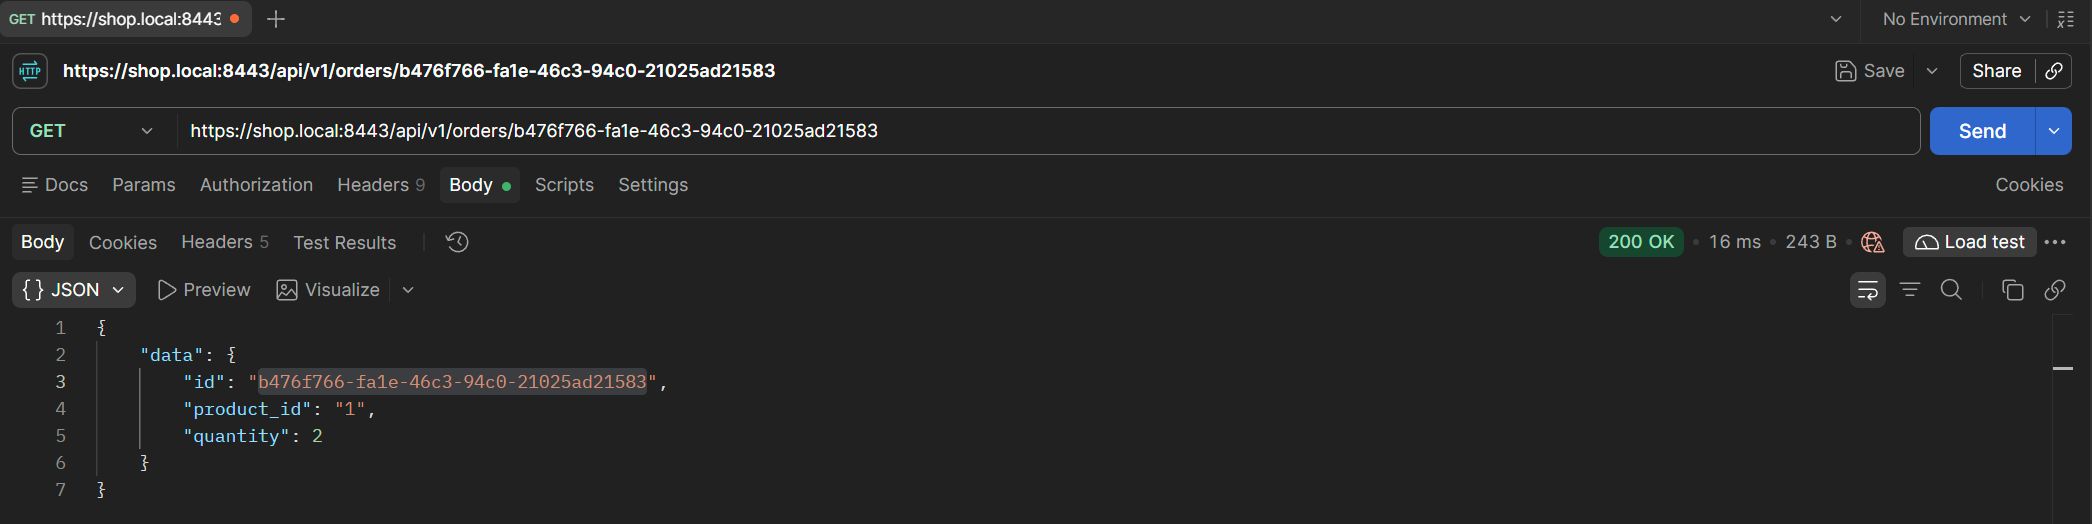
With this we can now make requests to https://shop.local:8443/api/v1/.... Since the certificate is self-signed, the client will complain, in Postman we disable SSL verification and with curl we use -k. You can see the result in the following images.
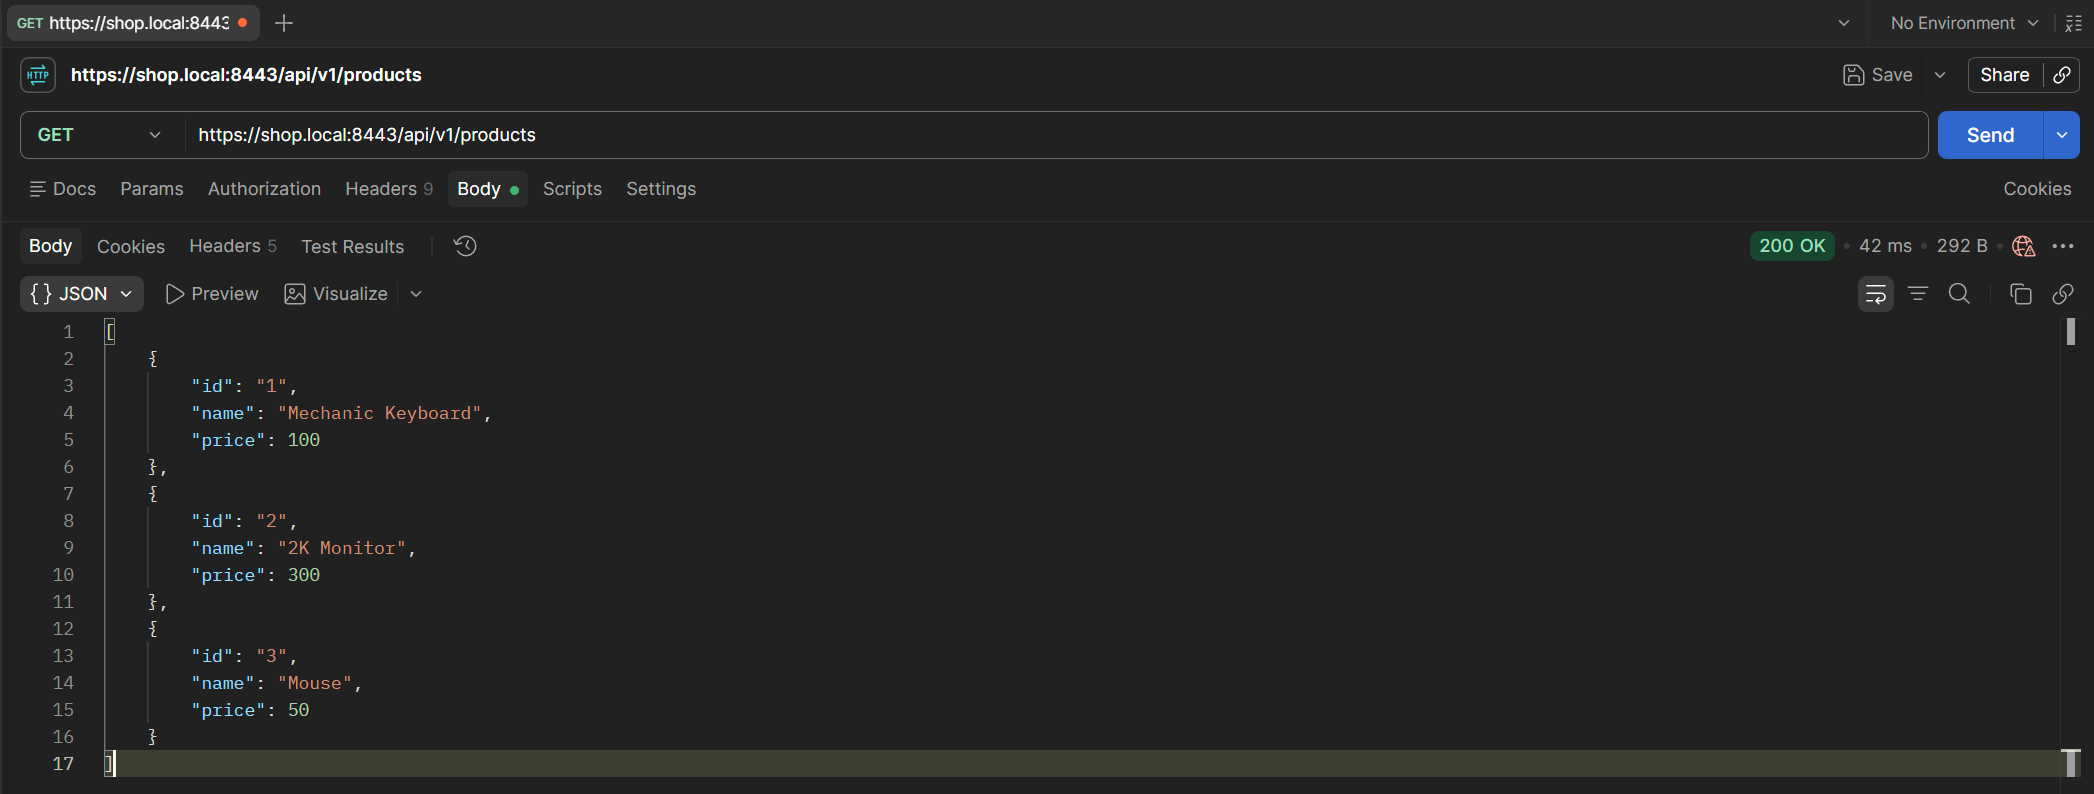
GET
/products
GET
/products/:id
POST
/orders
GET
/orders/:id
6 Network Policies L3/4/7
Network policies let us control the incoming (ingress) and outgoing (egress) traffic of the pods. Cilium extends the Kubernetes ones with its own objects: CiliumNetworkPolicy, which acts on a namespace, and CiliumClusterwideNetworkPolicy, which acts at cluster level and can also protect the nodes themselves.
Perhaps the most interesting part is L7 filtering. By adding rules to a policy, Cilium redirects the traffic to Envoy and filters it by content, for example blocking an HTTP method that is not allowed.
To configure the policies we will use the cnp.yaml file. This is a fragment to see how it works:
| |
For the API, which is the entry point, we have to allow traffic from
ingress(the Gateway) usingfromEntities.
This is the policy for the products microservice. From orders we allow traffic to port 8077, where the gRPC server runs, and from apigw to 8081, where the REST server listens.
Then we define what can be done on each port. orders only calls GetProductById, so it is the only gRPC method we let through (gRPC runs over HTTP/2, so it is filtered as a POST to the path /package.Service/Method). apigw queries both the product list and a specific product, so we allow GET /products and GET /products/{id}.
The same is repeated in the other two microservices. As soon as a policy selects a pod for ingress, everything that is not explicitly allowed is dropped. This way we block unexpected traffic, which reduces the attack surface and limits lateral movement if a pod gets compromised.
To test it, we launch an ephemeral container inside the orders pod and from there we call two methods: GetProductById, which is allowed in the policy, and GetProducts, which is not and therefore should be rejected (Access denied), as we can see in the following images.
| |
You can try it by replacing the pod name with that of one of your own pods.
targetis the name of the container within the pod, as defined in the Deployment manifest.
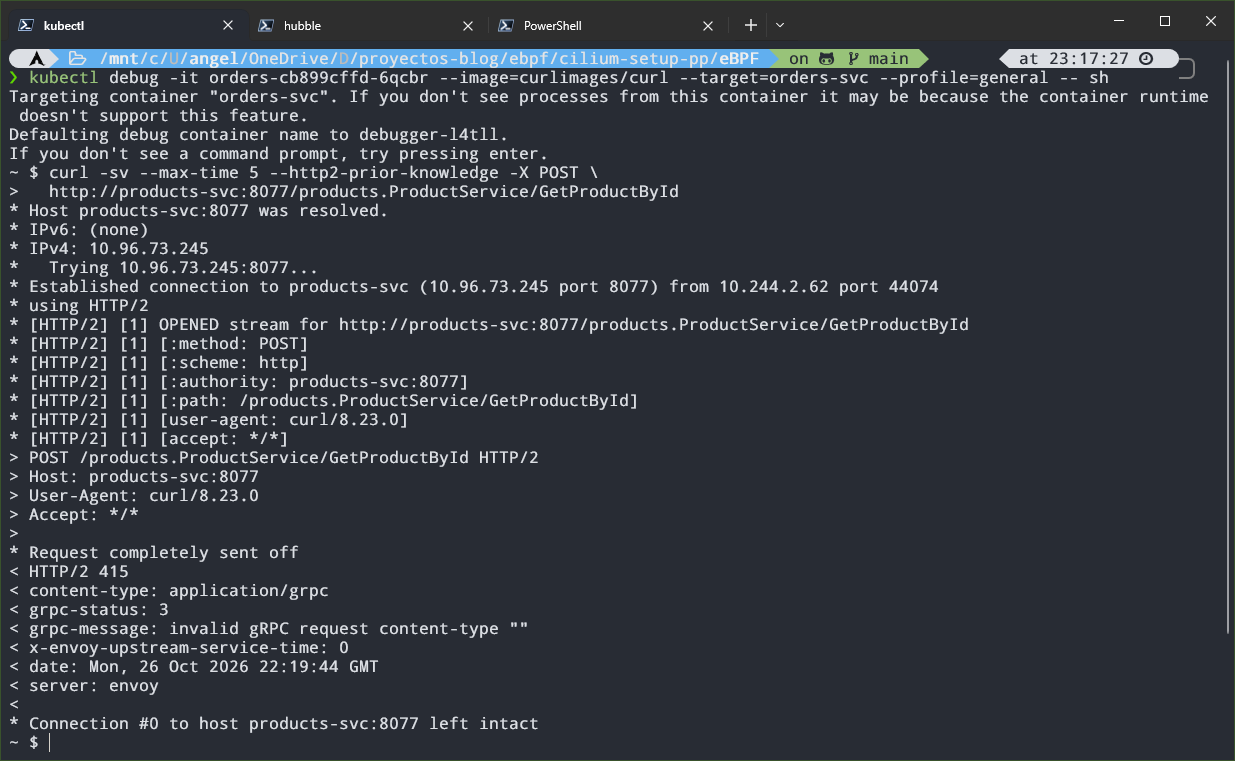
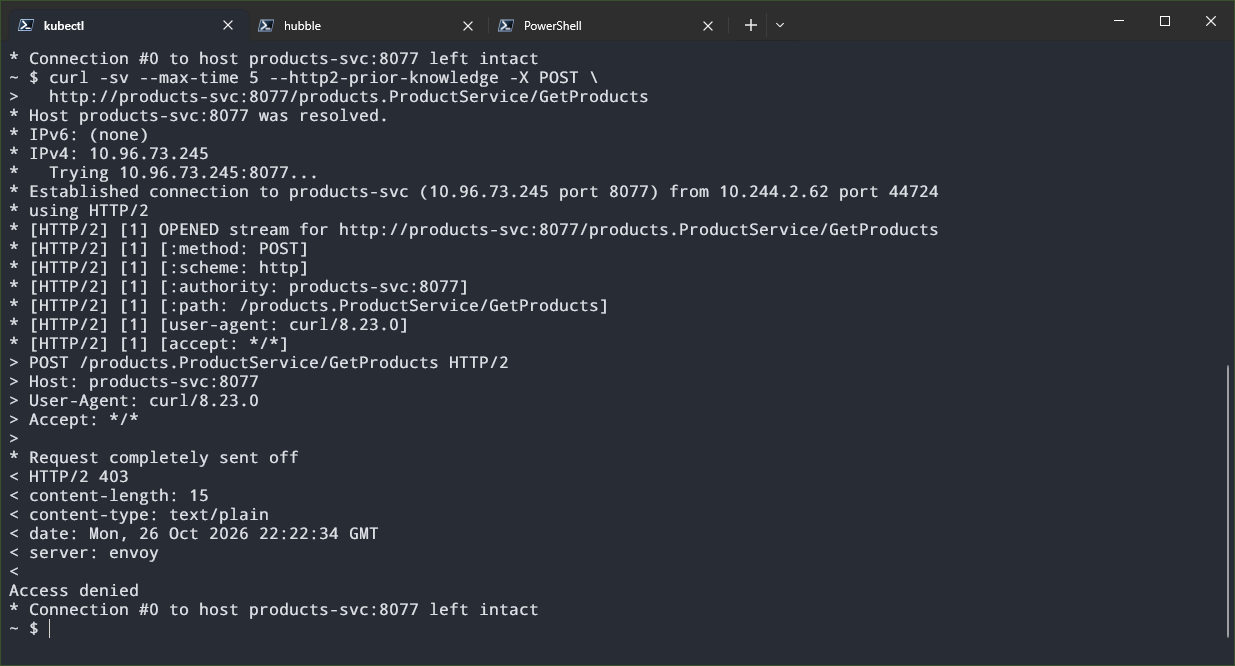
As you can see, we run a curl but for gRPC. Unlike REST, gRPC always uses POST as the method, and the URL carries the path of the gRPC method directly: /products.ProductService/GetProductById. Since we don’t use TLS, there is no negotiation possible, so with --http2-prior-knowledge we tell curl to speak HTTP/2 directly.
| |
Careful, this is not a real gRPC client. We don’t send the body in gRPC’s format, so don’t expect to see the products. What matters is the response: in GetProductById the request reaches the server and it returns a 415 since the content type is not supported, and in GetProducts the policy cuts it with a 403.
We can also see this with Hubble, which shows us the requests rejected by the policy (later on we will explain how the tool works).

Now we try the opposite: a curl to products from a temporary pod that no rule gives access to. Here there is no rejection response as before, because Cilium drops the packets and curl keeps waiting until the timeout hits:
| |
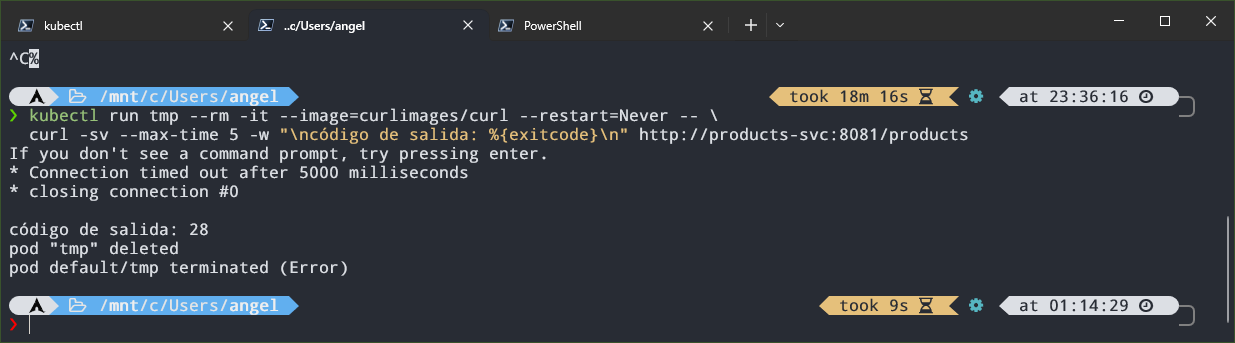
Notice the difference. When the policy denies at L7 level we get a response (Access denied), whereas when the source is not authorized at all (L3/L4) the packets are dropped and we get nothing, just the timeout (curl exits with code 28).
7 eBPF Agents
As we said, Cilium relies on eBPF (extended Berkeley Packet Filter), but eBPF is not just a Cilium thing, we can also write our own programs. An eBPF program usually has two parts:
- Kernel space: the program that runs inside the kernel. It defines the function, the hook it attaches to and the data structures (maps). It is usually written in C (restricted) and compiled to eBPF bytecode, although it can also be done in Rust. Before loading it, the verifier we saw earlier checks that it is safe.
- User space: a normal process that loads the program into the kernel and reads or writes the maps to retrieve the information and process it. Here there is more freedom of language (Go, C, Rust, Python…).
For our example we will write the kernel space in C and the user space in Go, with the cilium/ebpf library. As you may remember, we are going to create two agents: the first generates metrics from the latency of TCP connections, and the second blocks commands in certain pods. They are two sides of the same coin: observability and security.
7.1 Metrics agent: TCP connection latency
For this agent we use the sock:inet_sock_set_state tracepoint, which fires every time the state of a TCP socket changes. We measure, from the client side, the time between sending the SYN (SYN_SENT) and completing the handshake (ESTABLISHED).
A tracepoint is an instrumentation point that kernel developers have explicitly left in their code, and it tends to be more stable across versions than hooking internal functions.
In kernel space we use three structures:
- An LRU hash (least recently used) to temporarily store the timestamp of the start of each connection. If it fills up, it discards the least recently used entries, so it doesn’t grow without control.
- A per-CPU array, which keeps an independent copy per CPU and avoids locking when incrementing. It holds three counters of lost events, each one for a different reason.
- A ring buffer, through which we send the events with all the information needed to generate the logs and the metrics to user space.
We get the timestamps with bpf_ktime_get_ns(), which returns the nanoseconds elapsed since the system booted.
| |
The logic is as follows: on SYN_SENT we store the timestamp, and when we reach ESTABLISHED we retrieve it, compute the difference and send the event through the ring buffer. We only handle IPv4 (AF_INET).
The three counters of the per-CPU array cover these cases:
MISSING_TIMESTAMP: the connection is established but we can’t find its timestamp (for example, because the entry was evicted from the LRU). It’s an internal problem of the agent.RINGBUF_FULL: there is no room in the ring buffer for the event. Also internal.TCP_FAILED: the socket goes fromSYN_SENTtoCLOSE, that is, the connection attempt has failed (refused, timeout…).
For the user space we use bpf2go, a cilium/ebpf tool that compiles our C code to eBPF bytecode using Clang and generates the Go files needed to load the programs and maps from Go.
To automate this process, we create a gen.go file containing a //go:generate directive, where we indicate the compilation target and the C file we want to compile. Once the file is defined, we run go generate . from the package directory:
| |
Here we indicate the compilation target (
bpfel, which specifies little-endian BPF bytecode), the base name of the generated files (bpf) and the C file we want to compile.
In main.go we define a histogram with buckets adjusted to the latencies we observe, and a custom collector that reads the values from the per-CPU array and sums the total across all CPUs. In main we attach the program to the tracepoint, launch a goroutine with an infinite loop that reads the events from the ring buffer, records the latency in the histogram and generates a log, and finally we expose /metrics on port 2112 (the one used by the examples of the Prometheus library for Go).
The buckets in the code are already the adjusted ones, which I explain after the tests.
| |
7.1.1 Testing it locally
To test it locally before creating the DaemonSet, we generate, build and run it (with sudo, because loading eBPF programs requires privileges):
| |
With the program running, in another terminal we check that it has been loaded:
| |

In the agent’s terminal the logs with the information we send through the ring buffer should appear:
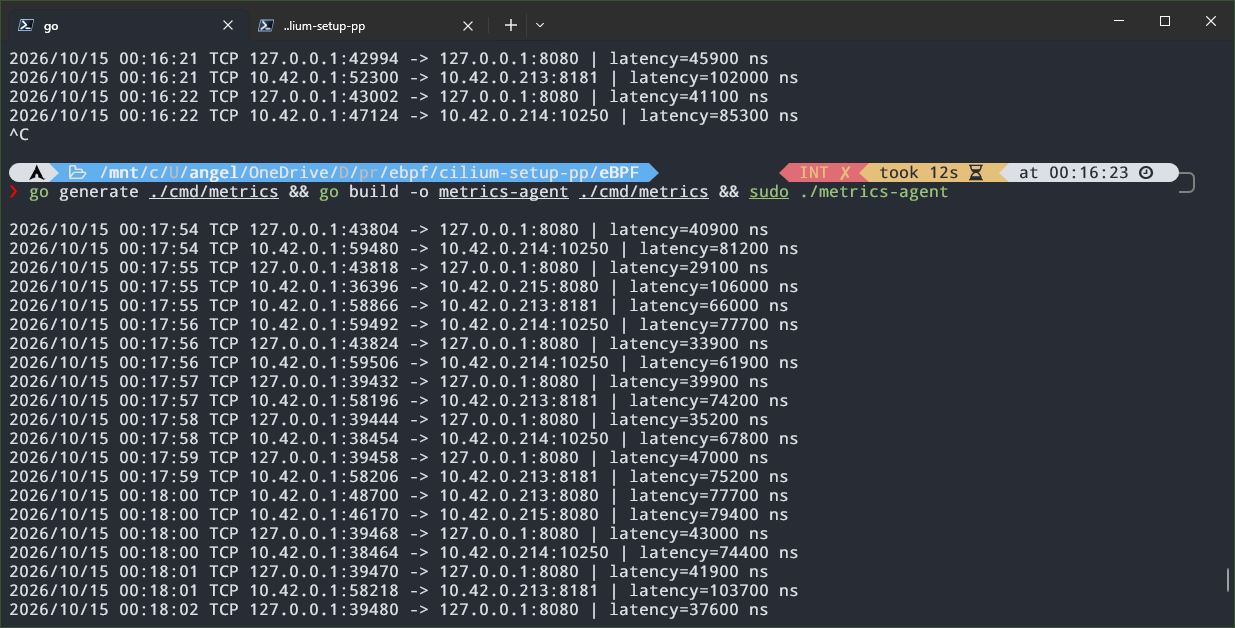
And to see the metrics we run a curl against /metrics and look for the name of the histogram and the collector:
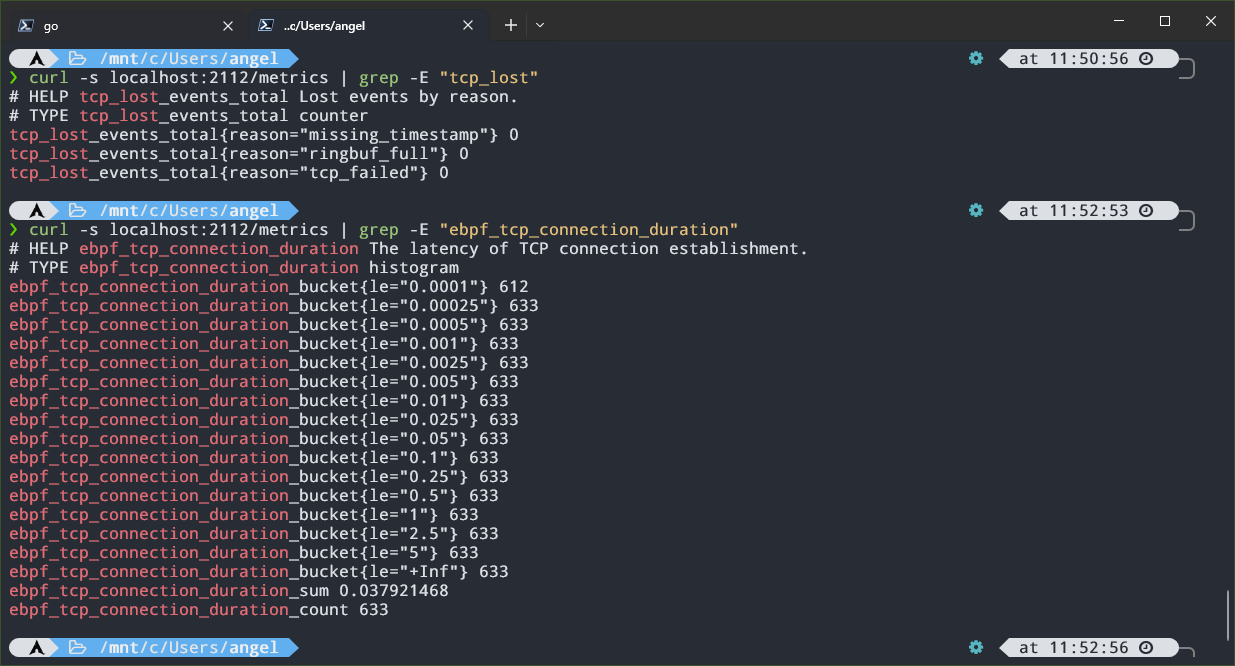
Of the 633 connections that had happened up to that point, 612 were resolved in less than 100µs. With the default buckets almost all of them fell in the first one, so we adjusted them to gain detail, which is where the values in the code above come from.
7.2 Security agent: blocking commands with BPF LSM
The second agent works differently, instead of observing, it acts. For that we use BPF LSM. LSM (Linux Security Modules) is the kernel framework where SELinux or AppArmor attach to the security hooks scattered across the code, and BPF LSM lets us attach eBPF programs there. Each hook fires when a process does something sensitive, and the program decides whether to allow it (returning 0) or deny it (returning a negative error, like -EPERM).
We will use bprm_check_security, which runs during execve, right before the kernel launches the new binary, and lets us veto the execution.
An LSM program runs for all the processes on the host (WSL, Docker, kind…). That’s why we only block the binaries that are in the block list and whose execution comes from a watched cgroup. For everything else, we return
0and nothing happens.
Before moving on to the implementation, we need to check whether bpf is active as an LSM in the kernel. In my case it was compiled in but not active. We can check it with:
| |
The first one shows the active LSMs (if bpf is not at the end of the list, it’s no good to us, since it is the one that allows running the programs we are creating) and the second one the kernel boot parameters. If the first file doesn’t exist, we have to mount securityfs first and check the LSM list again:
| |
Since we didn’t have bpf active, we modify (or create) the file %UserProfile%\.wslconfig, adding:
| |
Careful:
lsm=replaces the kernel’s default list, it doesn’t add to it. I used that one because it’s the one that came out ofcat /sys/kernel/security/lsm, but yours may be different: copy the one you get and addbpfat the end.
For the change to take effect, we restart WSL from PowerShell:
| |
And when we open it again, we check that the LSM list ends in bpf.
Back to our agent, we use two maps to filter: one with the paths of the binaries we want to block and another with the cgroups we watch. A cgroup is a Linux mechanism that groups processes to limit and account for their resources, and it’s what containers use. The runtime creates one per container, so the cgroup ID lets us identify which pod a process comes from. Finally, just like in the metrics agent, we use a ring buffer to send to user space who ran what.
| |
If we return
-EPERM,execvefails withOperation not permitted.
A couple of details about the code. The key of the paths map is a 64-byte array, which is why we initialize key to zeros: the map compares all 64 bytes, and this way whatever is left after the path doesn’t introduce garbage. Also, the comparison is textual, so /bin/cat and /usr/bin/cat are two different entries, and we will see it in the tests.
On the user space side, just like in the metrics agent, we expose /metrics on port 2112 and read the ring buffer in a goroutine. The only metric is a counter with the blocked executions. Since the agent runs inside the cluster (in a DaemonSet), we configure the Kubernetes client with InClusterConfig(). I’ve left the commands to block in a variable, although they could be passed through environment variables or a ConfigMap.
To decide which cgroups to watch we use two helper functions:
findCgroupID: receives the container ID, looks under/sys/fs/cgroupfor the directory of its cgroup and returns its inode, which matches the ID the kernel sees.syncCgroups: lists the pods with the labelebpf-sec=enforce(which we add to the microservices’ Deployments for testing), extracts the ID of each container, callsfindCgroupIDand, if it finds it, inserts it into the eBPF map.
Just like in the metrics agent, we use a
gen.goto generate the Go code with which we load the program and its maps.
| |
7.2.1 Testing it locally
To test it outside the cluster we make a few adjustments; in main we comment out everything related to the Kubernetes client (since the agent isn’t running as a DaemonSet) and add a flag to pass the path of a test cgroup, whose ID we insert into the kernel map. It could be hardcoded, but this way is more convenient.
| |
The commands to block change. On the local machine the binaries are in /usr/bin, while in the microservices’ images they are in /bin. As an example we block curl and cat:
| |
We can see the path of a command with
type <command>in the test terminal.
Now we create the cgroup and launch a shell inside it, from which we will run the test commands:
| |
This creates the
prueba(test) cgroup, puts the shell’s PID in itscgroup.procs(so the shell becomes a member of the cgroup) and replaces it withbash. Everything we run from there inherits the cgroup.
In another terminal we build and launch the agent pointing to that cgroup:
| |
If we now run cat or curl from the cgroup’s shell, they are denied:
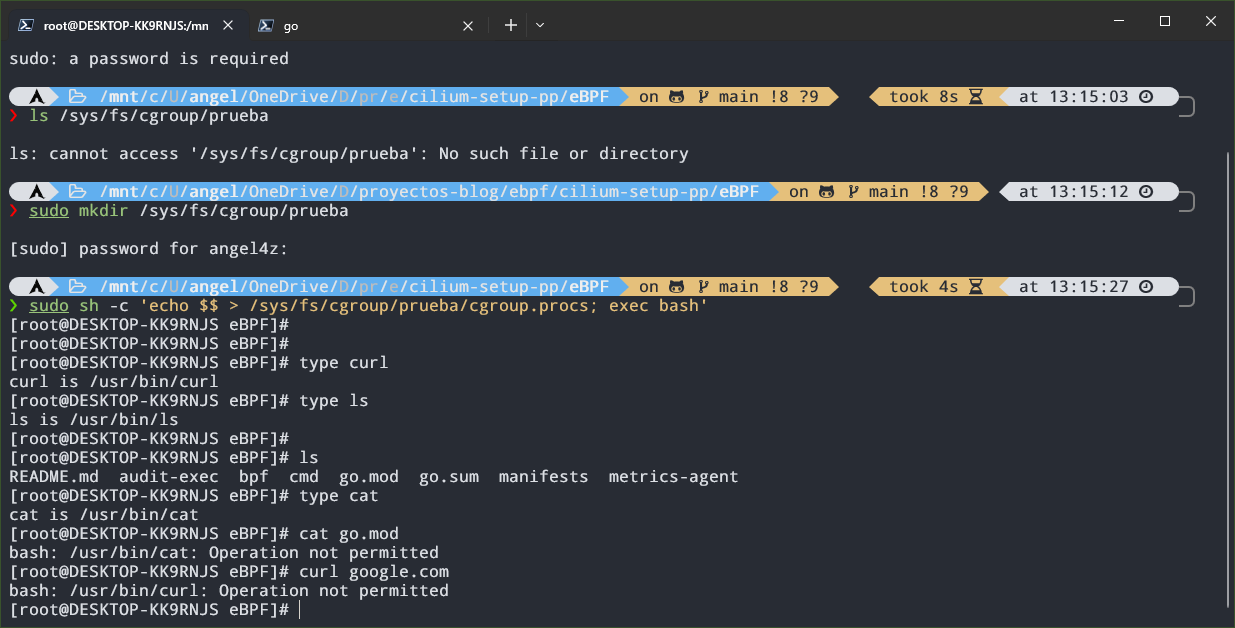
Meanwhile, the agent logs the watched cgroup and the blocked commands:
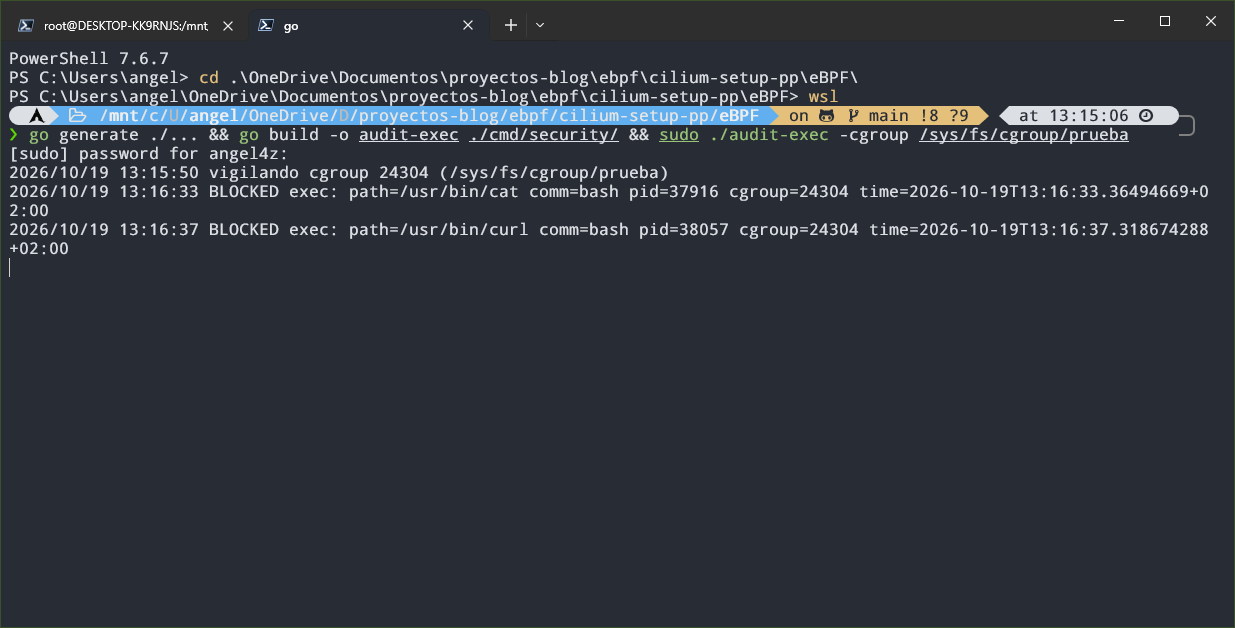
And if we check /metrics in another terminal, we will see the counter of blocked executions:
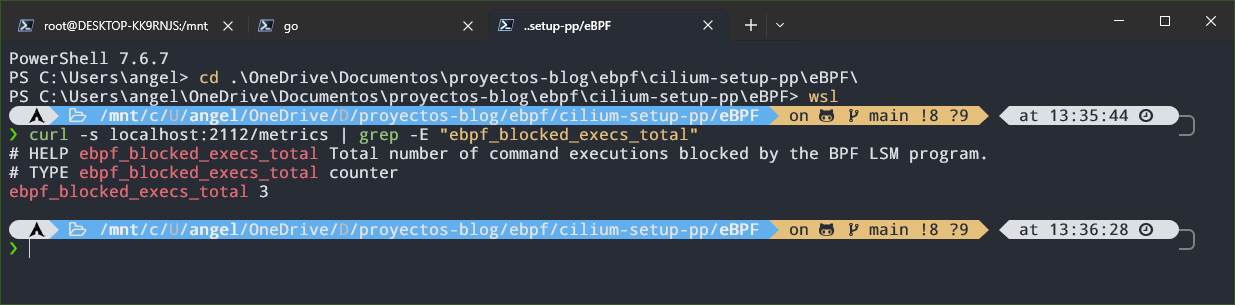
When we are done, we exit the test shell and delete the cgroup with sudo rmdir /sys/fs/cgroup/prueba.
7.3 Deploying the agents in the cluster
Just like with the microservices, we build the images and load them into kind:
| |
Before building the security agent’s image, remember to put back the paths of the microservices’ images (/bin/curl and /bin/cat).
With the images loaded, we deploy the DaemonSets, which create one pod of each agent per node. Since we have three workers, we will have three pods of each:
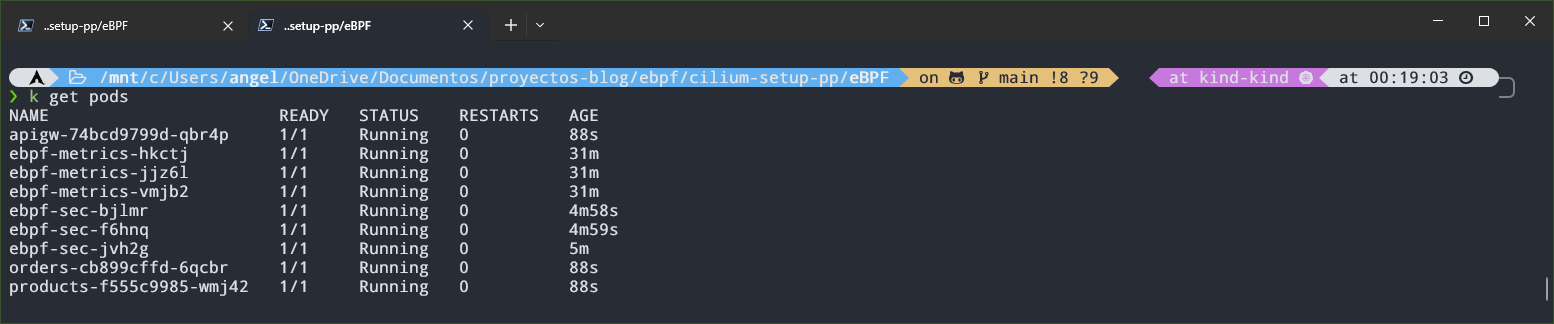
The security agent also needs permissions to list pods, because otherwise it will use the default service account and the cluster will deny the request. That’s why we create a ServiceAccount, a ClusterRole with read permissions on pods and a ClusterRoleBinding that joins them.
To check that the metrics agent works, the easiest way is to port-forward to one of its pods and curl /metrics:
| |
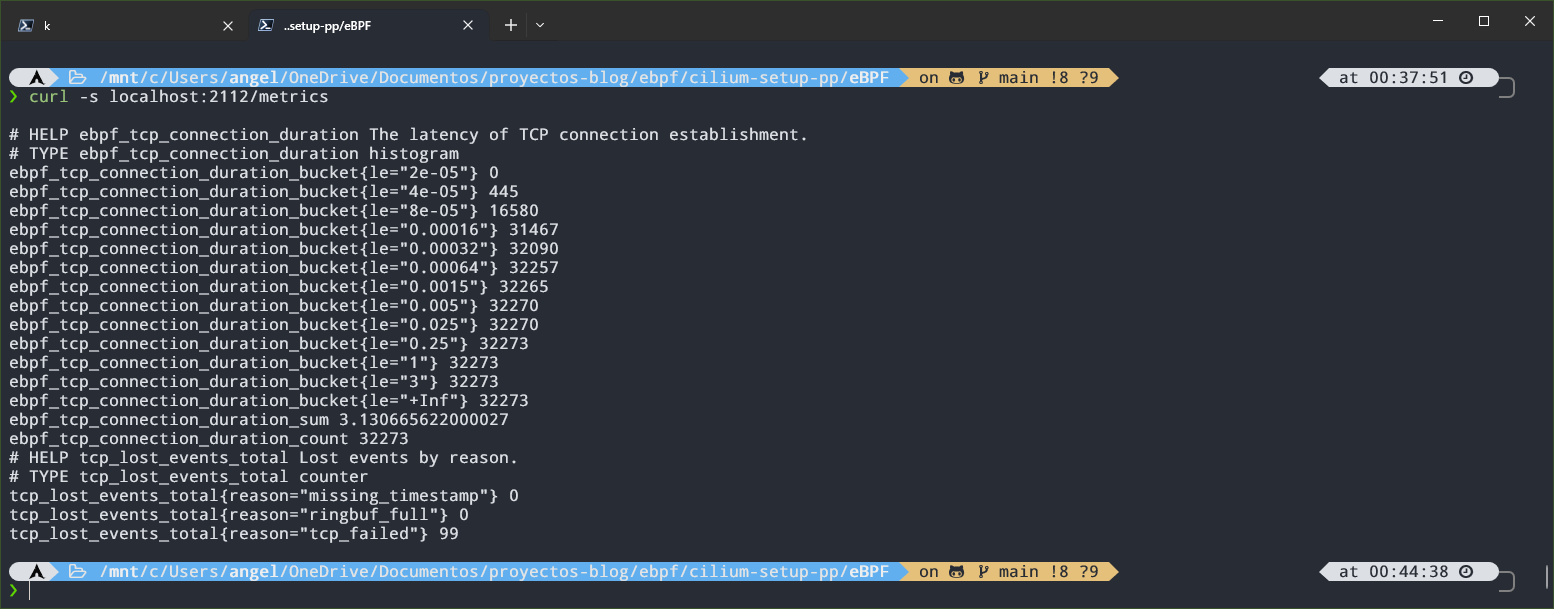
For the security agent we have to add the label ebpf-sec: enforce in spec.template.metadata.labels of the microservices’ Deployments (the labels of the pods that get created), so they are recreated with it. In the logs of each agent pod we see this:



Each pod of the DaemonSet only finds in its /sys/fs/cgroup the cgroups of the containers of its own node. Since the microservices each run on a different node (in my case, by decision of the Kubernetes scheduler), each agent pod ends up watching a different microservice.
If we now try to run a blocked command inside one of the microservices, it gets denied:
| |
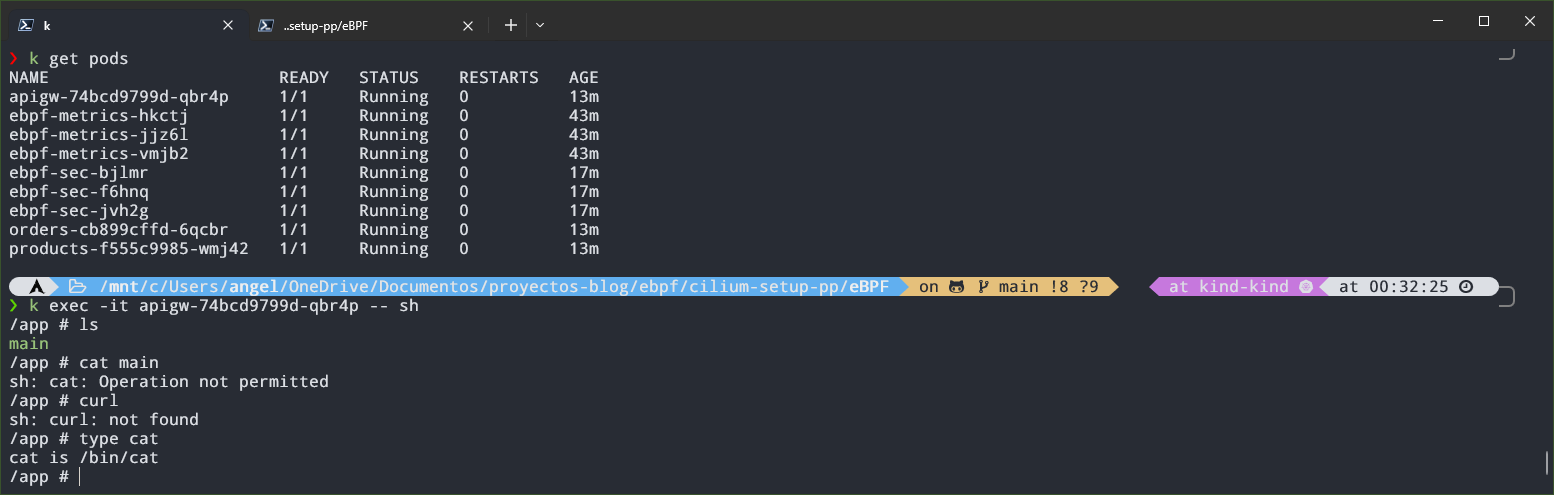
To see the metrics we repeat the previous process with the security agent’s pod:
| |

Note that I did the port-forward to the pod that watches the
apigwcgroup, which is where I ran the command. If you look at the metrics of another pod where we haven’t run anything, the counter will stay at 0.
8 Observability
Earlier we showed how to enable the /metrics endpoint so Prometheus can read it, and also how to activate Hubble. Now let’s put all the pieces of the puzzle together to complete the observability infrastructure.
The first thing will be to install both Prometheus and Grafana. For that we will use the community Helm charts:
| |
With the last command, first we create the
monitoringnamespace, which didn’t exist until now, and second, we install the Prometheus stack with the namekps.
The Helm chart we just installed contains, among other things, the following:
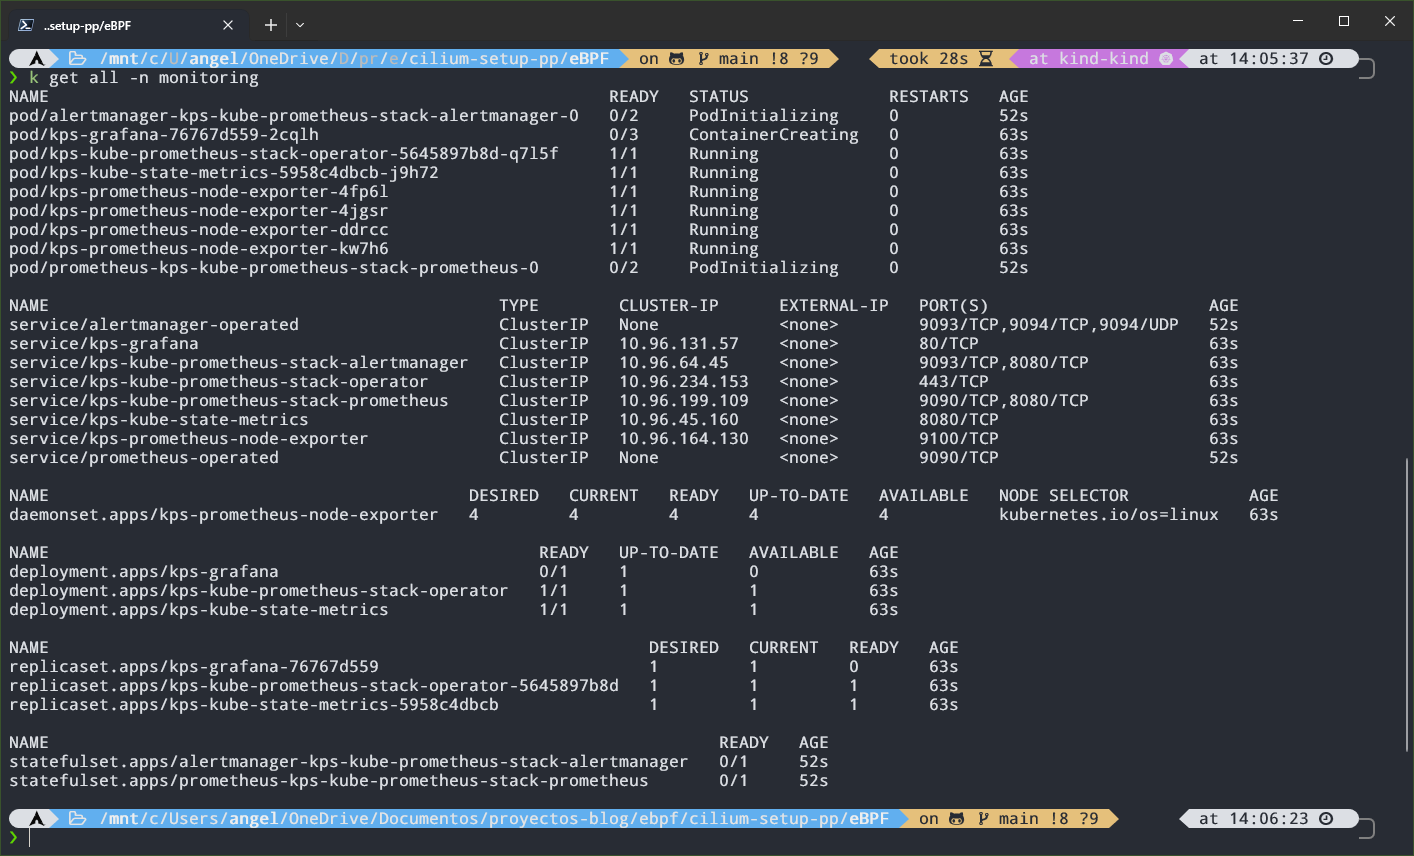
- Prometheus, together with its operator, which adds its own objects such as
PodMonitororServiceMonitorto tell it what to scrape. - Grafana, which comes already connected to Prometheus and ships with preloaded dashboards through ConfigMaps.
- Alertmanager, to manage alerts.
node-exporter(one pod per node, as a DaemonSet) andkube-state-metrics, which export metrics about the nodes and the state of Kubernetes objects, respectively.
For Prometheus to read the metrics of the eBPF agents we created, we have to declare a PodMonitor. Together with ServiceMonitor, it is a CRD (Custom Resource Definition) added by the Prometheus Operator, included in the Helm chart, and it is used to tell Prometheus which endpoints to scrape. The ServiceMonitor discovers targets through a Service, while the PodMonitor selects pods directly, which is what we need in our case, since our agents run as DaemonSets and have no Service.
| |
Since we have two agents, we use matchExpressions, although we could also create two PodMonitors and just use matchLabels. Also, we deploy the resource in the monitoring namespace and make it look in default (by default it looks in the namespace where it was deployed), and we have to specify the name of the Helm release with release: kps.
Now let’s build the charts in Grafana to give shape to the metrics we have generated. To see the Grafana interface we can port-forward to the service and put the URL in the browser. The user is admin and, to get the password, we run:
| |
Once inside, we can check whether Prometheus is reading the metrics by going to Explore and, with the Prometheus data source, searching for the metrics we defined in user space.
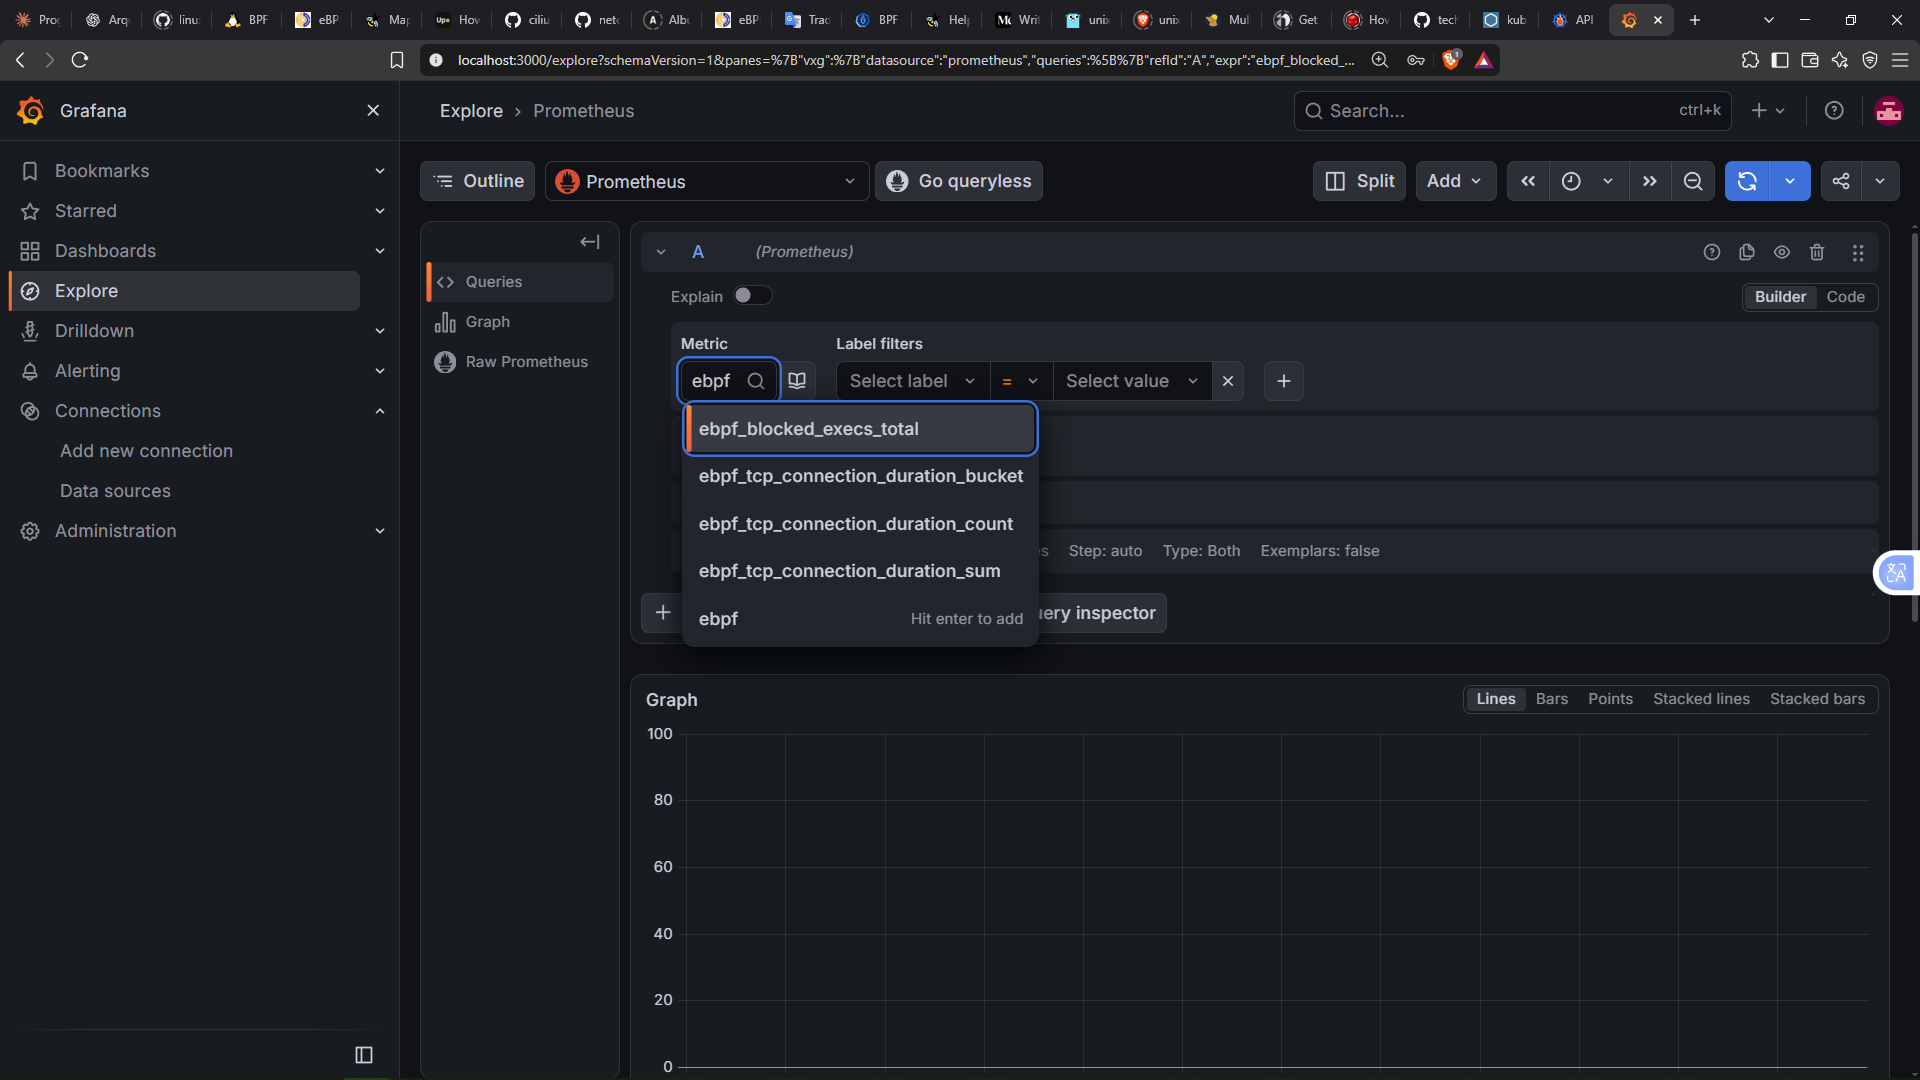
You can also search for the
tcp_lost_events_totalmetric and it will show up.
Now let’s build the charts with our metrics to get as much detail as possible. For that we go to the Dashboards tab, create a new one and add a panel for each metric.
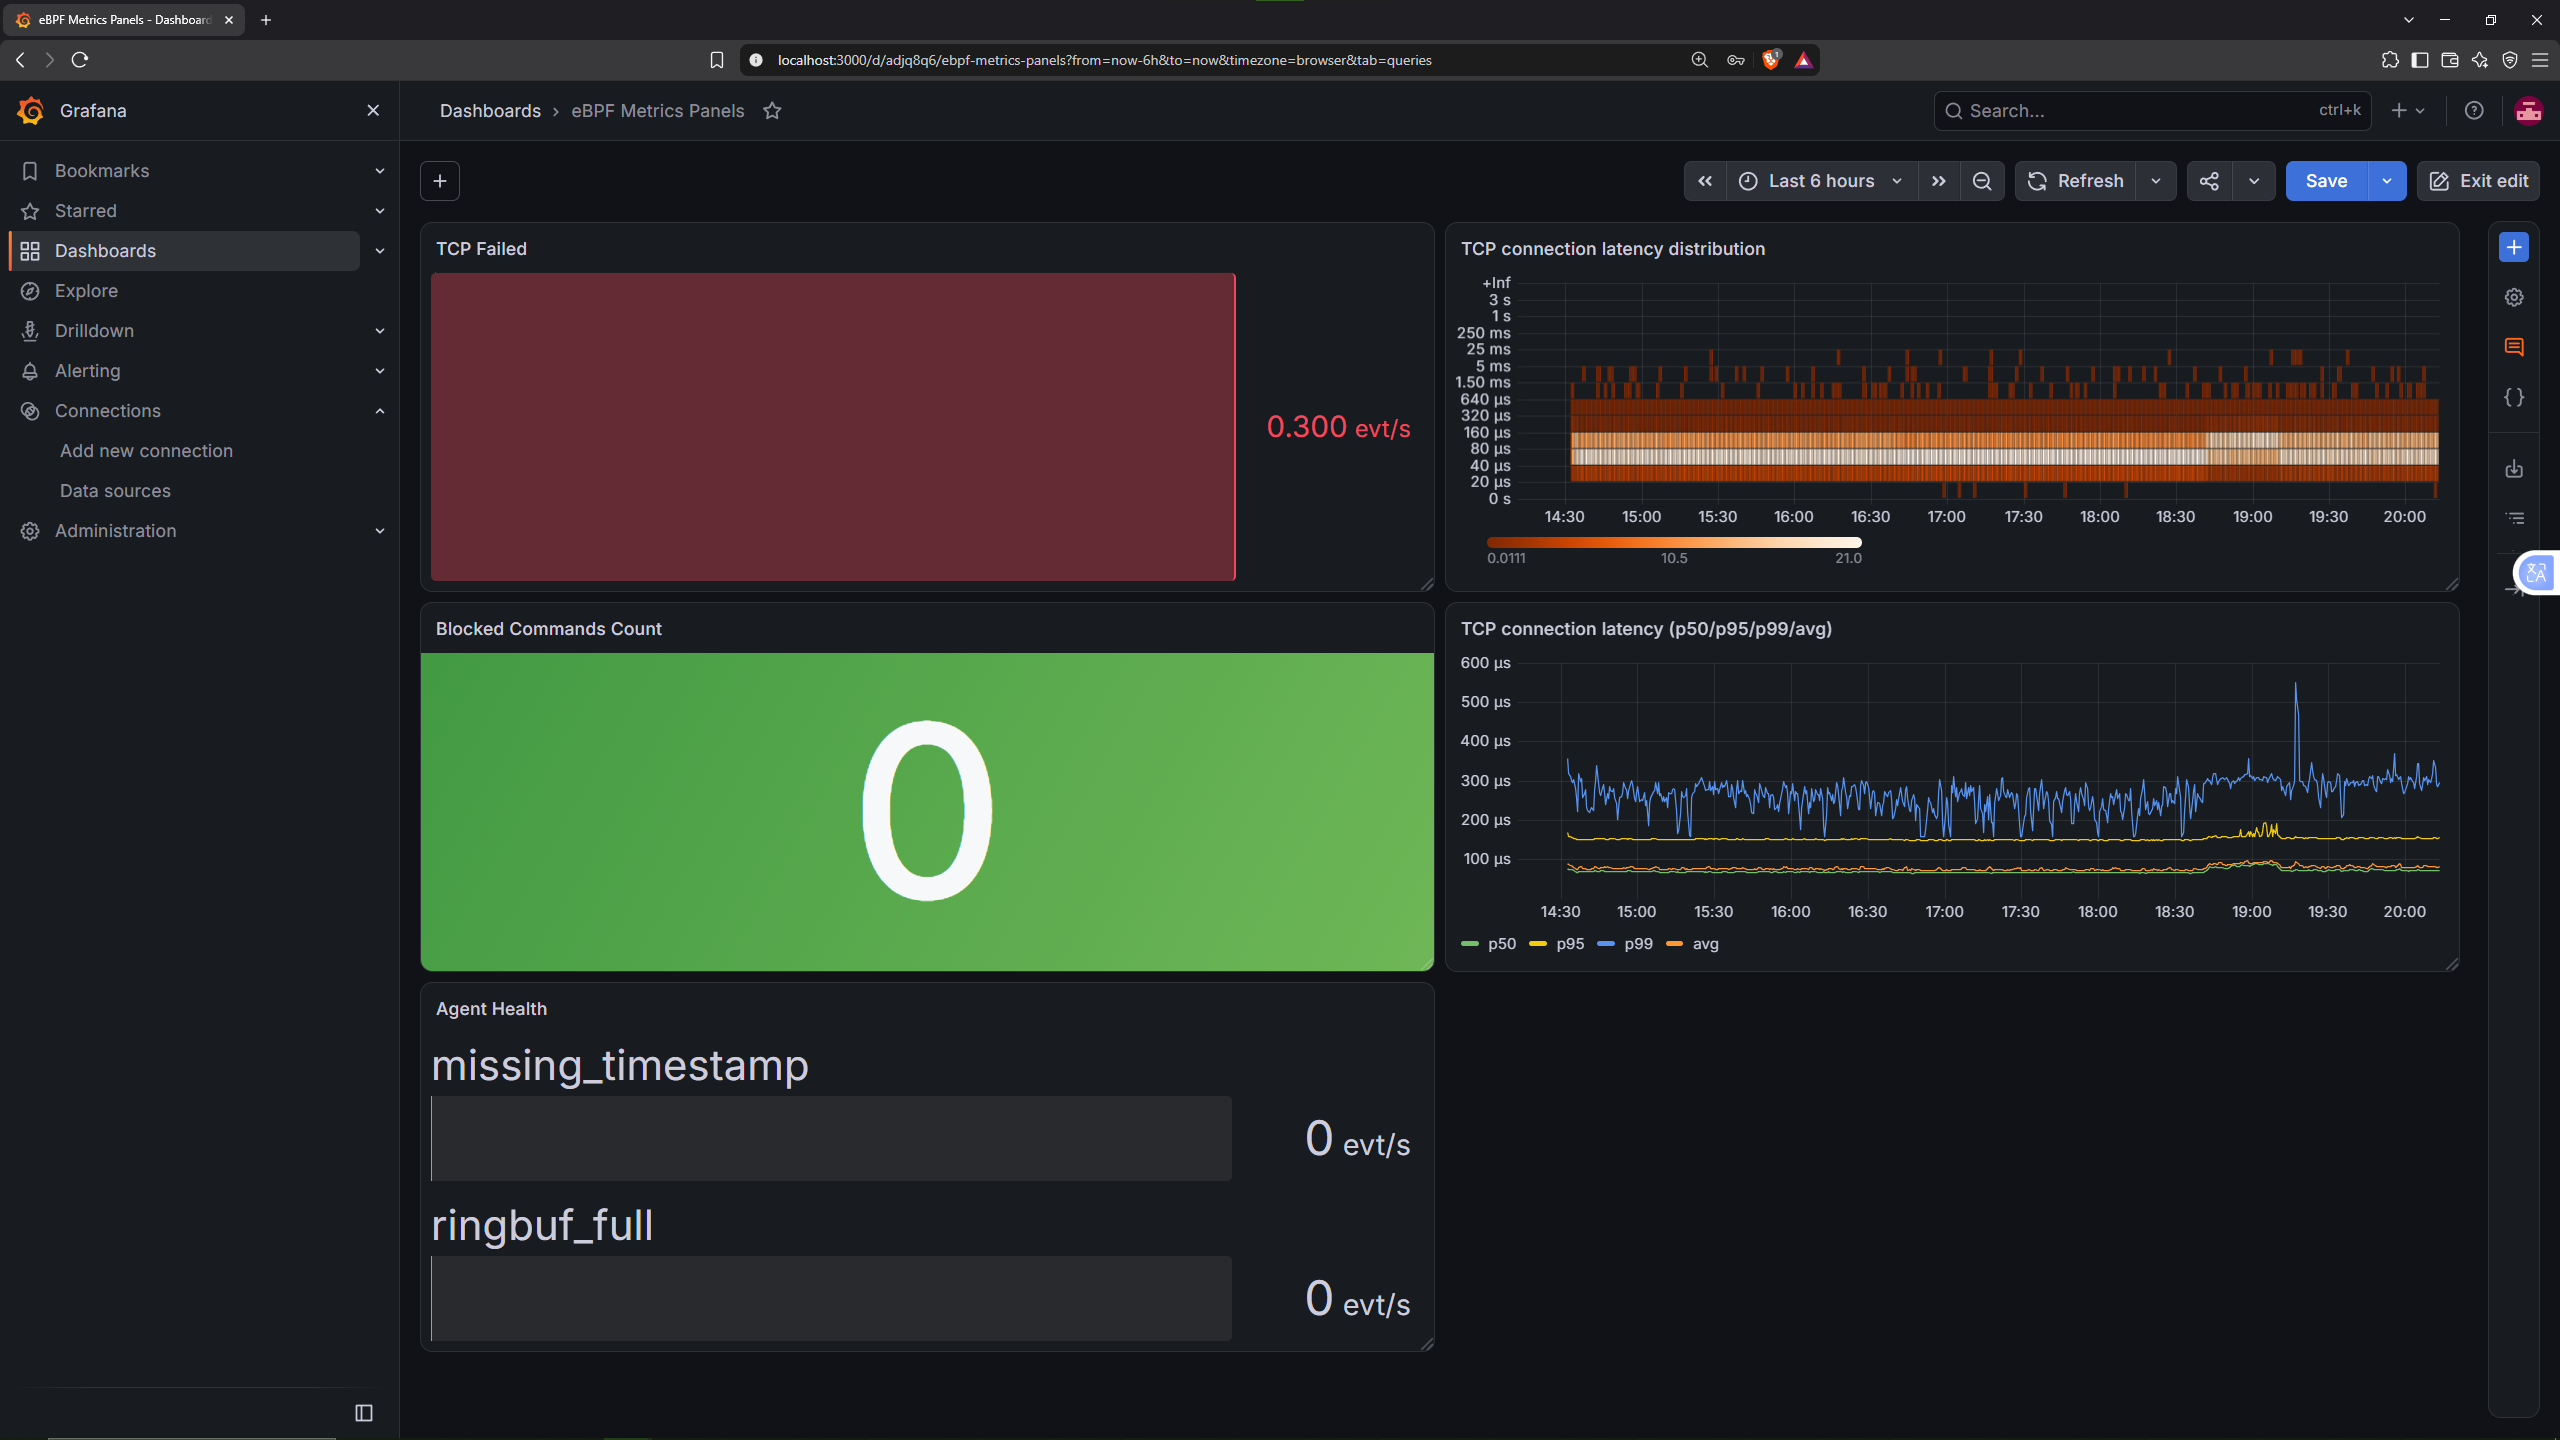
I have created the following panels:
- TCP lost connections (two panels): one with the connections that fail and another with the events that the eBPF agent itself couldn’t record (for example, because the timestamp is missing or because the ring buffer is full).
- TCP connection latency (two panels): from the Prometheus histogram, a Time series with the 50th, 95th and 99th percentiles together with the average, and a Heatmap with the values collected by the buckets.
- Blocked commands: a counter with the total number of executions denied by the LSM program, which, as you can see, is at zero because we haven’t blocked anything yet.
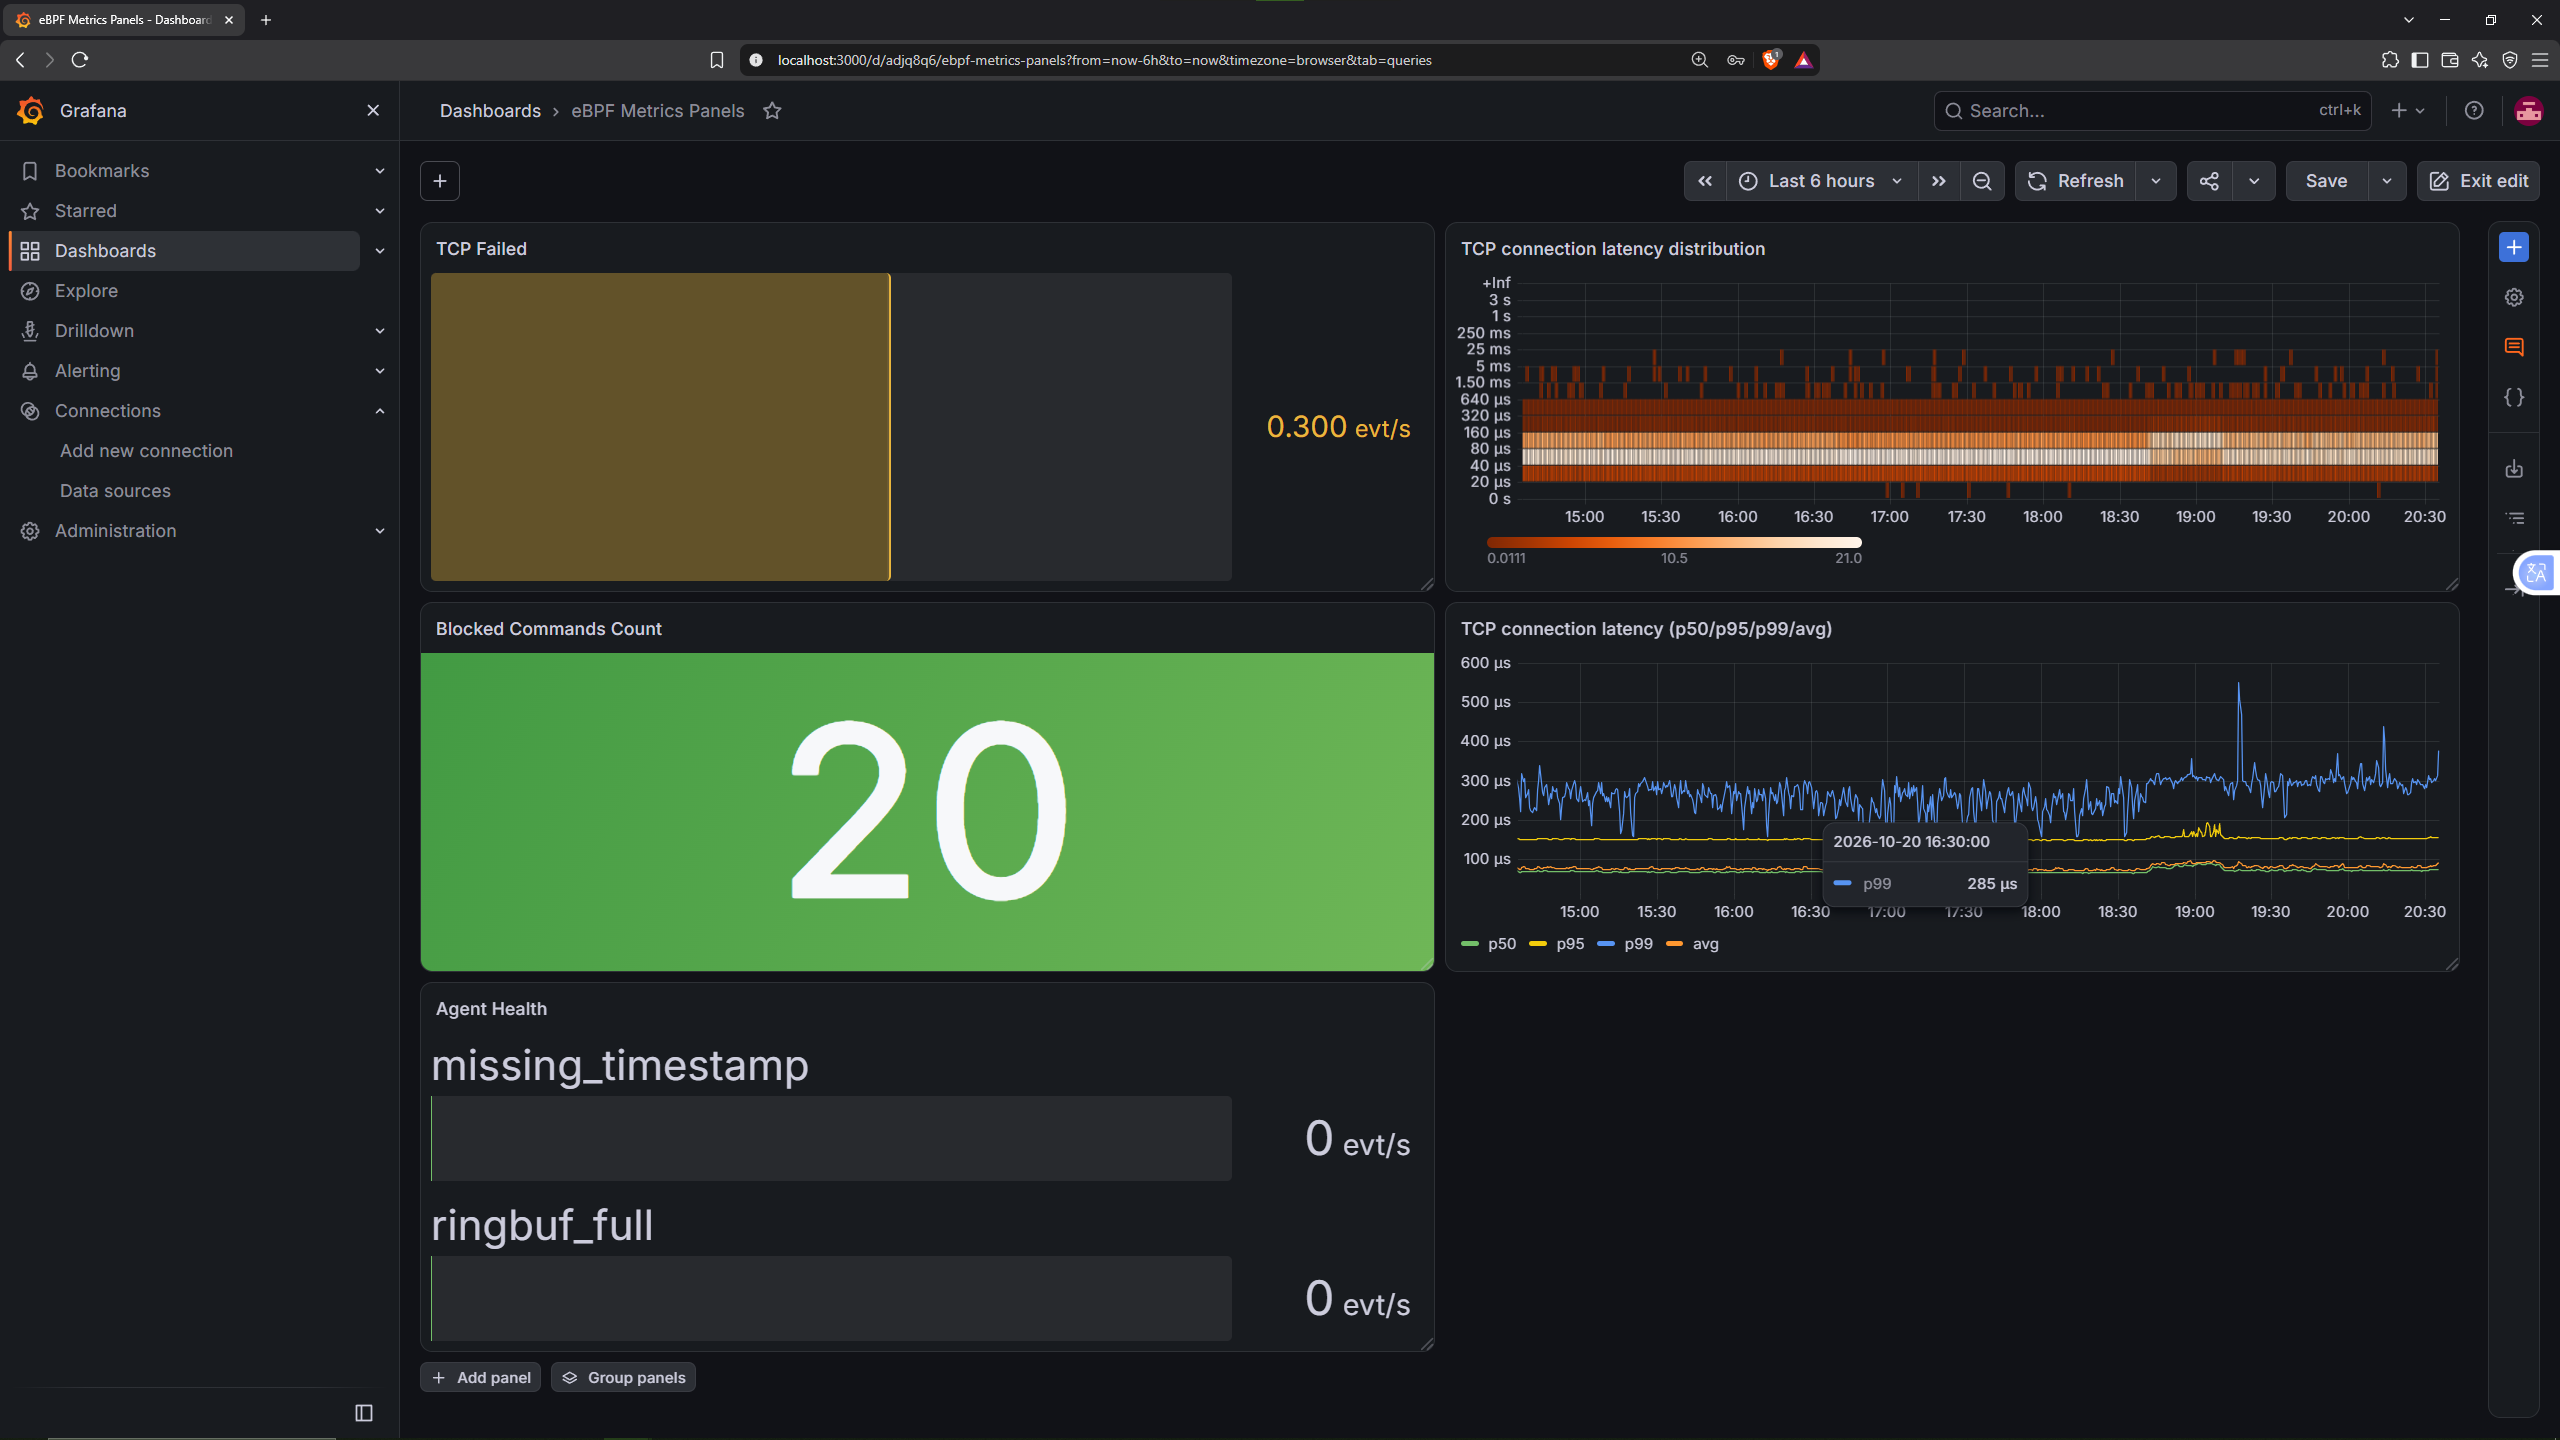
To see it in action, we run a loop inside the apigw pod, which carries the watch label. Every cat will be denied by the LSM hook:
| |
This runs a 20-iteration loop that launches a
catand waits one second, inside theapigwpod. Sincecatis in the blocked commands list, every attempt fails withOperation not permittedand the agent counts it.
After a moment (by default, Prometheus scrapes metrics every 15 seconds), we refresh the dashboard and the counter will have gone up:
We shouldn’t forget about the Hubble and Cilium metrics. To start with Hubble, we port-forward and check the connectivity status with:
| |
For Prometheus to see the Hubble metrics (and the Cilium ones we enabled earlier in the article) we have to do two things: indicate which Hubble metrics we want to export and create a ServiceMonitor for each component. We need one for Hubble, another for the Cilium agent and another for the operator, and the Cilium chart itself generates them with the following parameters:
| |
The
release=kpslabel is the one the chart’s Prometheus looks for to accept a monitor, and it must match the name of our Helm release. Without it, Prometheus ignores it.
Before looking at the metrics in Grafana, let’s use hubble observe, which shows in the terminal the individual events (flows) that Hubble holds in memory. This way you can see the difference with the metrics we generated with eBPF.
Taking advantage of the CiliumNetworkPolicys we defined in the network policies section, we will launch a curl to products from a temporary pod that no rule authorizes. This should drop the traffic and we will be able to see it in Hubble.
In one terminal we leave Hubble listening, filtering only the dropped packets and removing the noise of ICMP traffic:
| |
And in another we launch the request:
| |
This runs a
curltoproductsfrom a temporary pod. Since no rule allows this traffic, Cilium drops the packets andcurlends with a timeout. I used theClusterIPof theproductsservice, which will be different in your cluster.
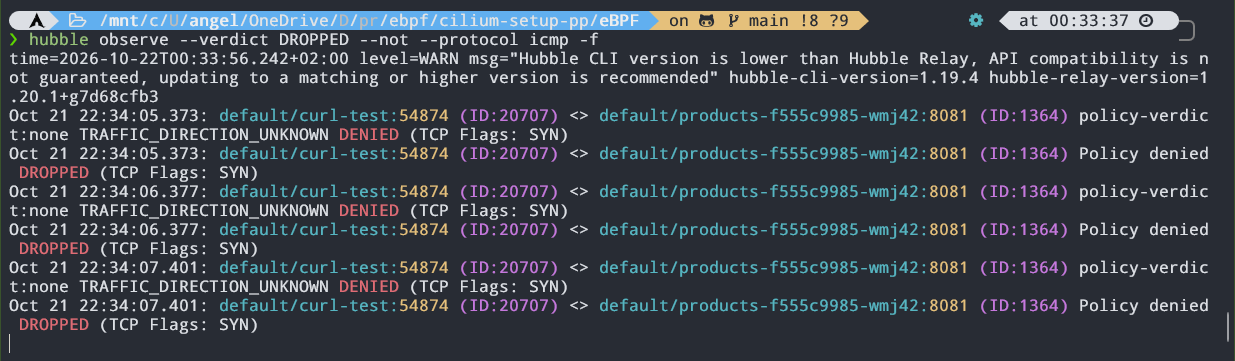
In the output we see the source and destination, the Cilium security identity of each one, the verdict (Policy denied DROPPED) and the TCP flags. Only the SYN appears, the first packet of the handshake, repeated on every retry, because the packet is dropped and never reaches its destination.
Going back to the metrics, in Grafana we can go to Explore to check whether Prometheus is indeed reading the metrics correctly.
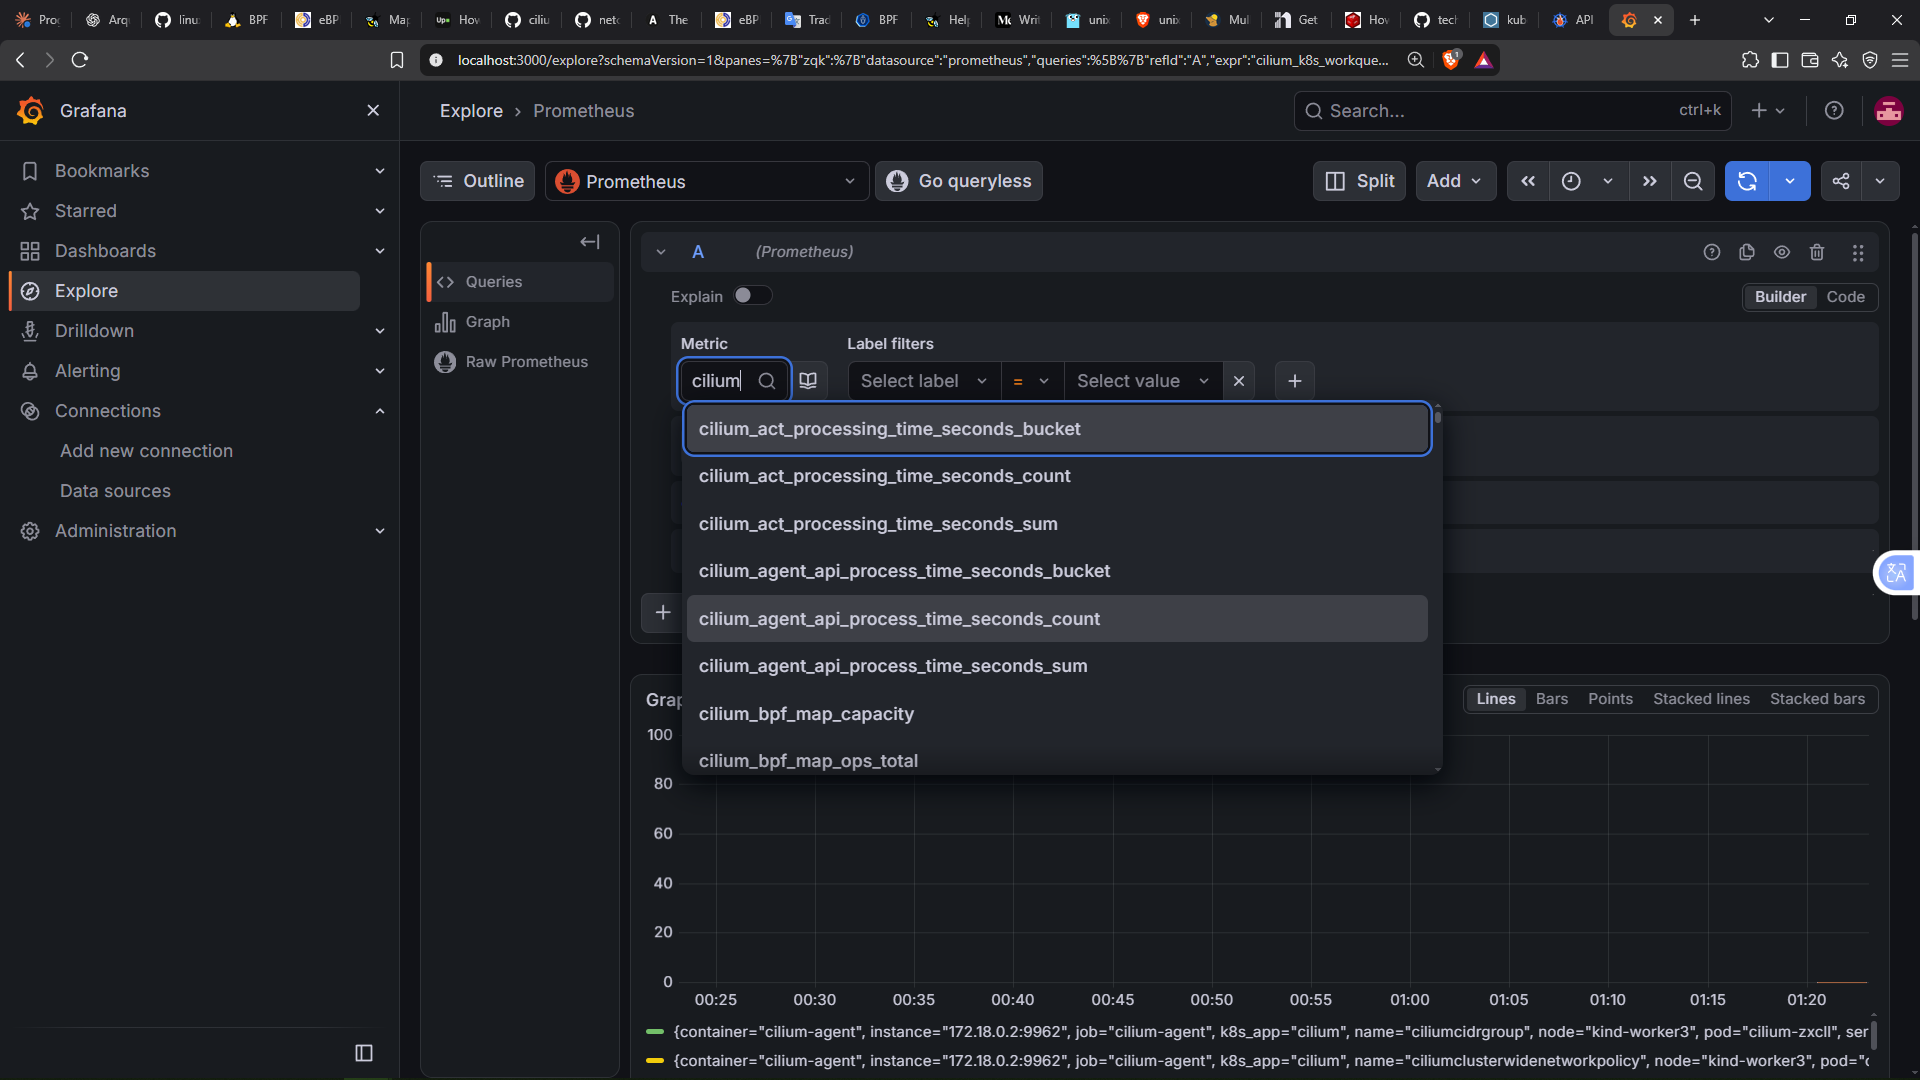
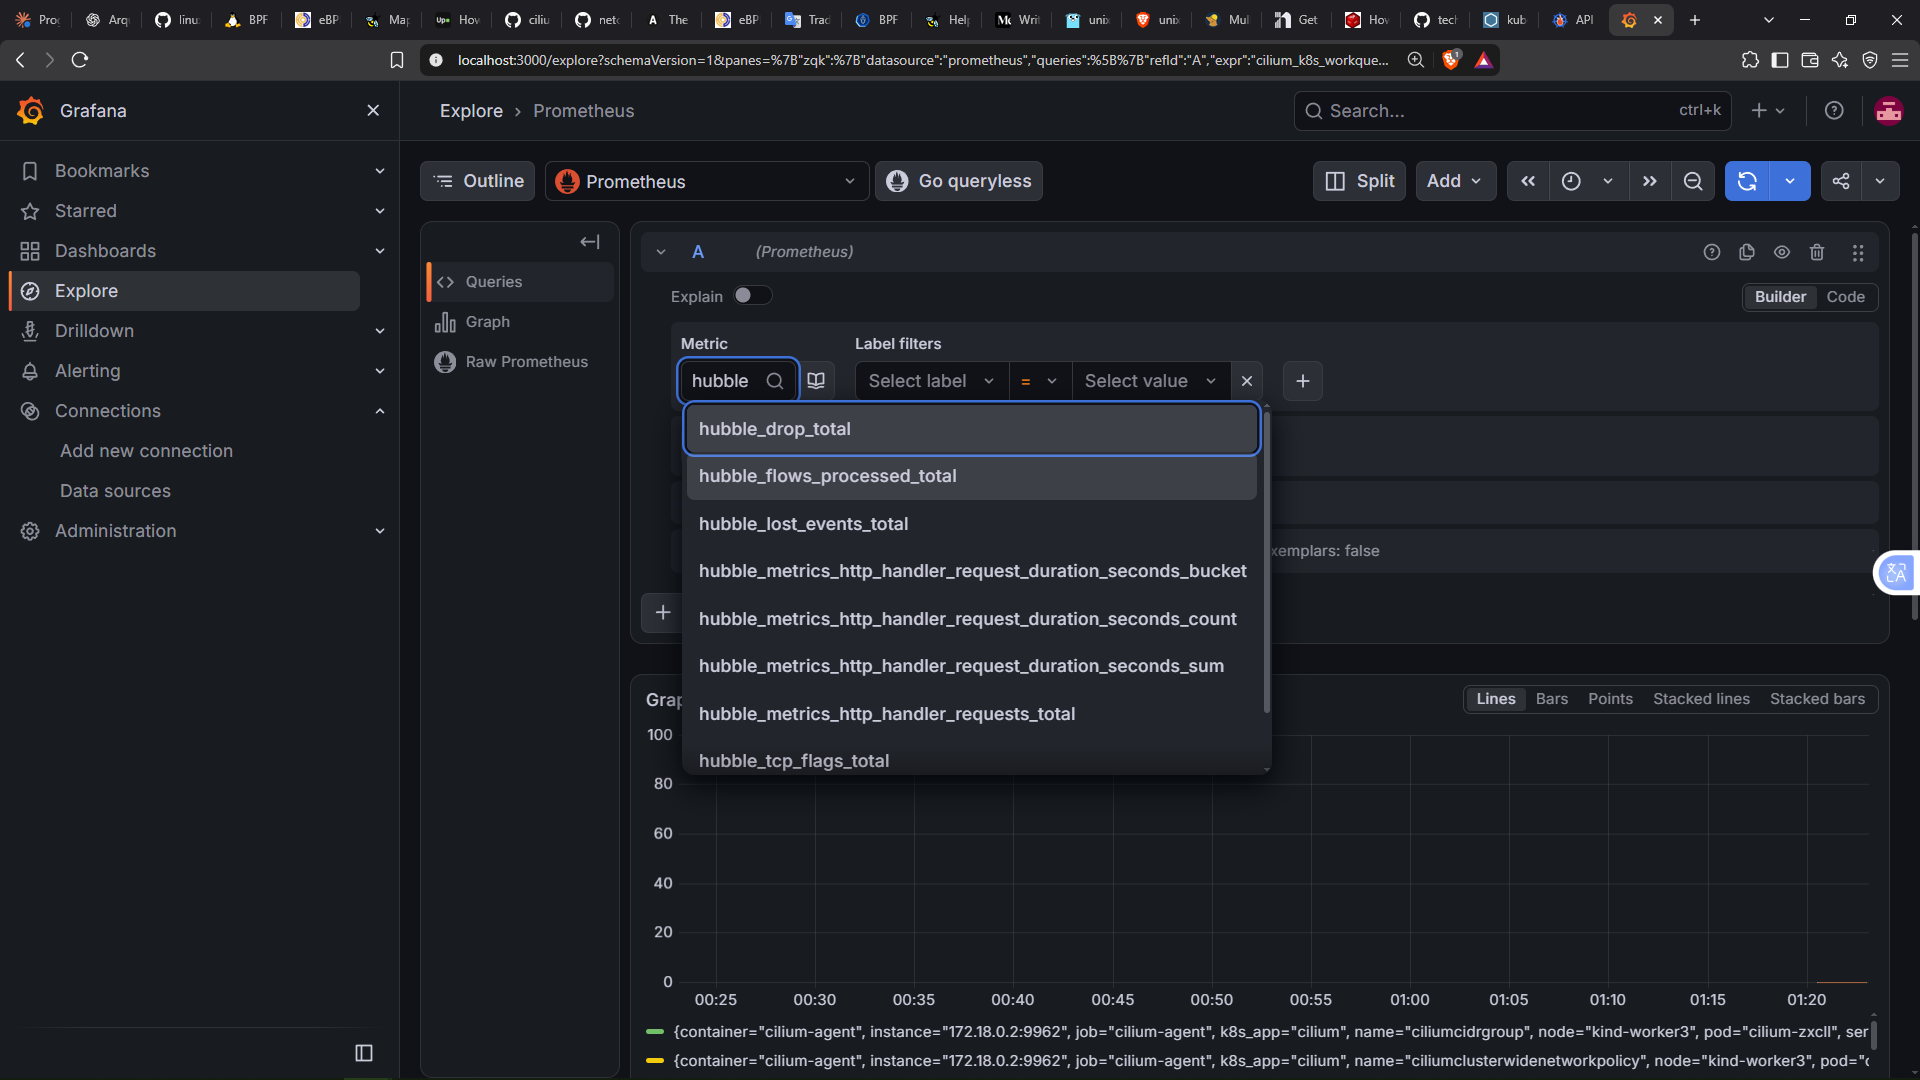
As the screenshots show, both the Hubble and the Cilium metrics appear in the search box. With this we could build a great variety of dashboards, but that deserves a post of its own.
As an example, I built a dashboard with three panels. In the first one we have the packets dropped by Hubble (hubble_drop_total); in the second, the processed flows (hubble_flows_processed_total), with the forwarded ones in yellow and the dropped ones in green; and in the third, all the errors and warnings from the Cilium agent pods (cilium_errors_warnings_total).
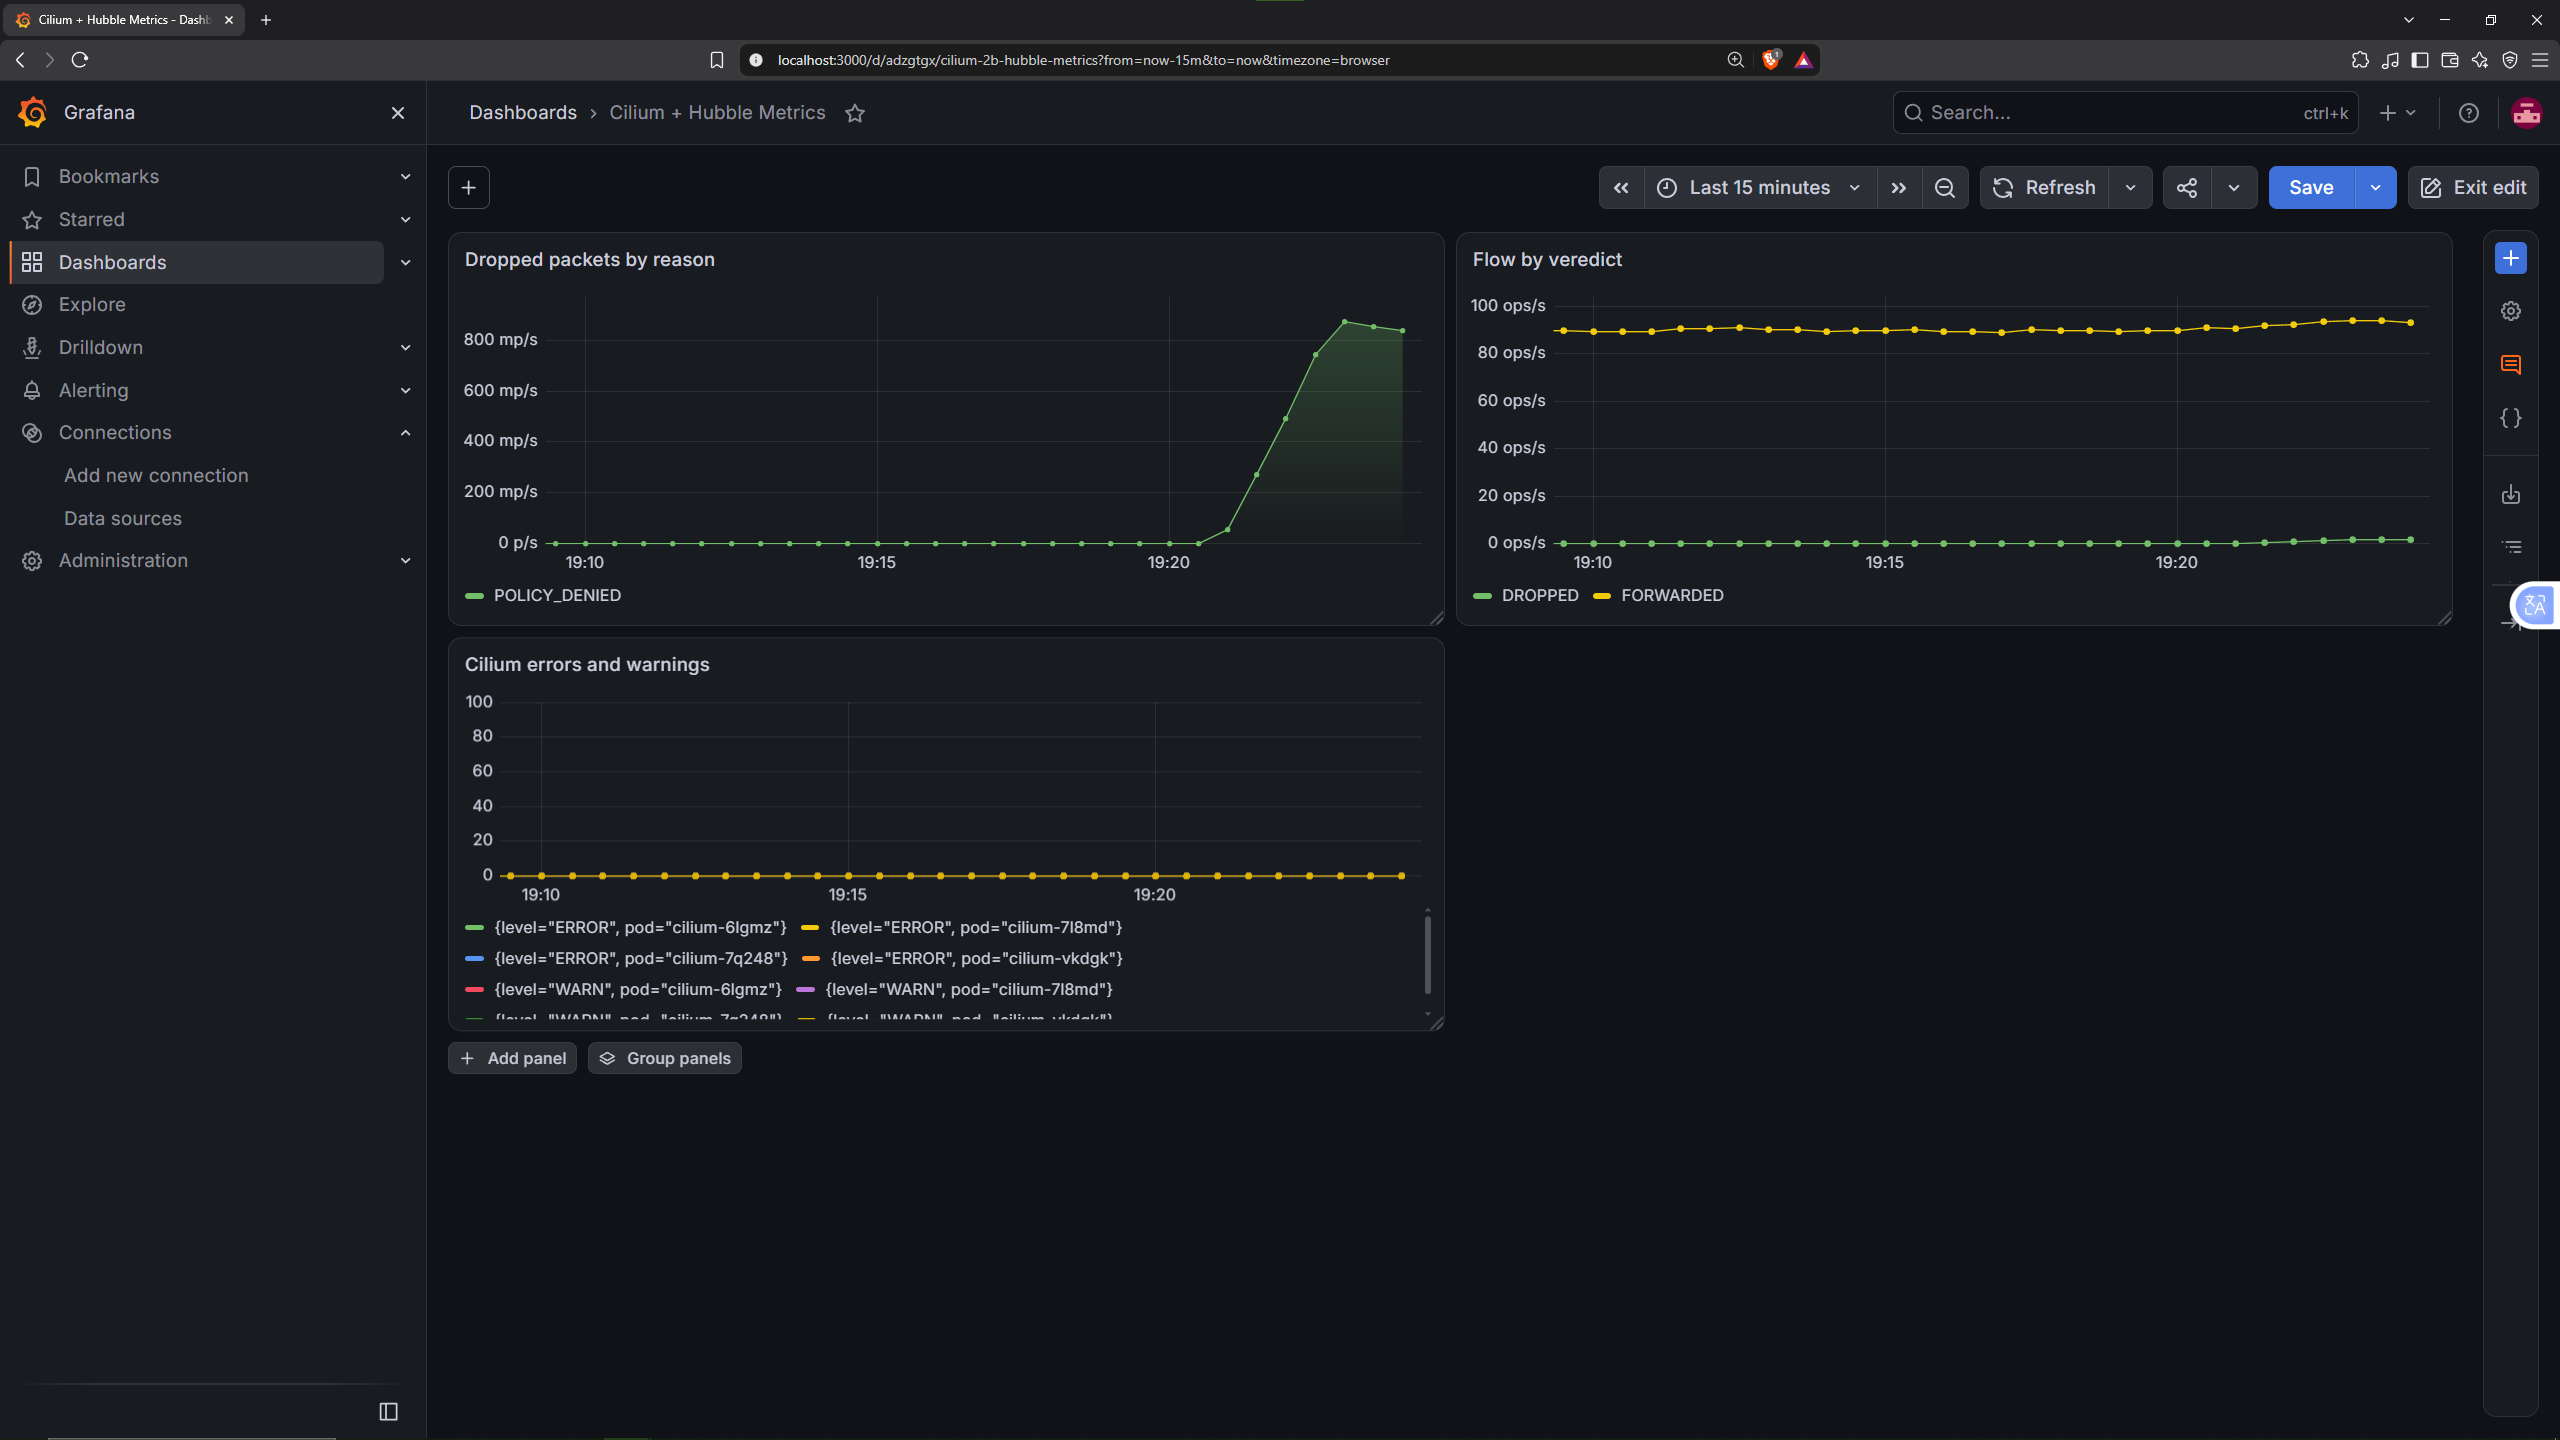
To generate data in the charts, the previous
curlwas run in a loop.
Collecting these metrics is especially useful to get more visibility and detail about what is happening in our cluster, so we can identify what is going on and act accordingly.
9 Additional Notes
Some of you who are more familiar with the topic may already know Tetragon, an open-source tool from the Cilium ecosystem focused on observability and runtime security. Using eBPF, it allows us to monitor process activity within the cluster and enforce security policies without having to develop our own agents from scratch.
For example, we could define a TracingPolicy to prevent certain pods from executing specific commands, thus covering a large part of our security agent’s functionality. The observability agent, however, is another story. Our TCP latency metric requires correlating a socket’s transitions between SYN_SENT and ESTABLISHED, calculating the difference between both timestamps in the kernel, and exporting the results as a Prometheus histogram. This is custom logic that Tetragon does not provide directly through its policies.
If you were already familiar with the tool, you may have wondered why we didn’t use it. Tetragon is particularly interesting for enforcing security policies in Kubernetes without having to develop the entire instrumentation infrastructure from scratch. In the context of this article, however, I thought it would be more educational to implement the agents manually to understand how eBPF programs work under the hood and illustrate some of their possibilities. Furthermore, doing so allows us to adapt the logic exactly to our needs, without limiting ourselves to the functionality offered by an existing tool.
That said, we have to be realistic; the security agent is a demo. It blocks executions based on the text of the executable’s path and does not provide context about processes. Tetragon offers a much more complete solution in that regard, but developing our own agent has allowed us to directly explore the mechanisms that make these kinds of tools possible.
10 Conclusion
That wraps up the article. Remember that you can find all the code used in this post, including the .yaml manifests, at the following links:
- Microservices code (
grpcbranch): https://github.com/azuar4e/micros-sample/tree/grpc - eBPF agents code: https://github.com/azuar4e/ebpf-observability-security
In essence, we have learned to deploy and configure Cilium so that, besides being the CNI, it also takes care of Service Mesh duties like encryption between nodes with WireGuard, HTTPS with the outside world through Kubernetes’ Gateway API and control of the traffic allowed inside the cluster with network policies. We have also compared the differences and advantages between a REST implementation and one based on gRPC.
And, perhaps the most interesting part, we have programmed two eBPF agents, using C for the kernel space code and Go for the user space. The first measures the latency of TCP connection establishment and exposes it through a Prometheus histogram; the second lets us block the execution of certain binaries in the containers we select, also recording the denied attempts as metrics.
To close the circle, we have set up a complete observability stack: Hubble to observe the cluster’s events, Prometheus to collect the metrics (those of Hubble, those of the Cilium agent and operator and those of our eBPF agents) and Grafana, using Prometheus as a data source, to shape them into charts and dashboards.
This is just a sample of everything that can be done with Cilium and eBPF, and I hope it has been useful to understand its relevance in modern infrastructures.
Thanks for reading, see you in the next one. Take care! 👋